AI Reporting for Business TeamsFrom Excel Data to Finished Reports.
Analyze Excel or CSV data, uncover the drivers, and deliver polished reports, interactive dashboards, and editable PowerPoint files in one workflow.



MCP & SKILLS
Connect MCP. Deliver reports in your Agent.
ExcelDashboard AI provides an MCP server and a report Skill. Your Agent analyzes and verifies data, then creates visual reports, tracks progress, and gets live previews. First connection requires user sign-in and workspace selection.
Connection information for Agents
Production MCP endpoint
https://api.exceldashboard.ai/mcp
Streamable HTTP · OAuth · create_report / get_report
Agents: read https://www.exceldashboard.ai/mcp.md for the complete English Skill, outline format, and client setup. Reading documentation does not configure MCP or complete OAuth.
Setup instruction for your Agent
Read https://www.exceldashboard.ai/mcp.md, including the full report Skill and outline reference. Use this client's supported workflow to configure ExcelDashboard AI MCP at https://api.exceldashboard.ai/mcp with Streamable HTTP. Guide me through browser OAuth and workspace selection. Install the report Skill from https://smithery.ai/skills/exceldashboard-ai/exceldashboard-report if supported; otherwise follow its complete instructions in this conversation. Verify the current session discovers create_report and get_report. Do not create a report. If this client cannot configure a custom MCP connection, explain that limitation and give its supported setup steps; do not claim a connection from reading the website.
One AI workspace
Three ways to turn data into answers.
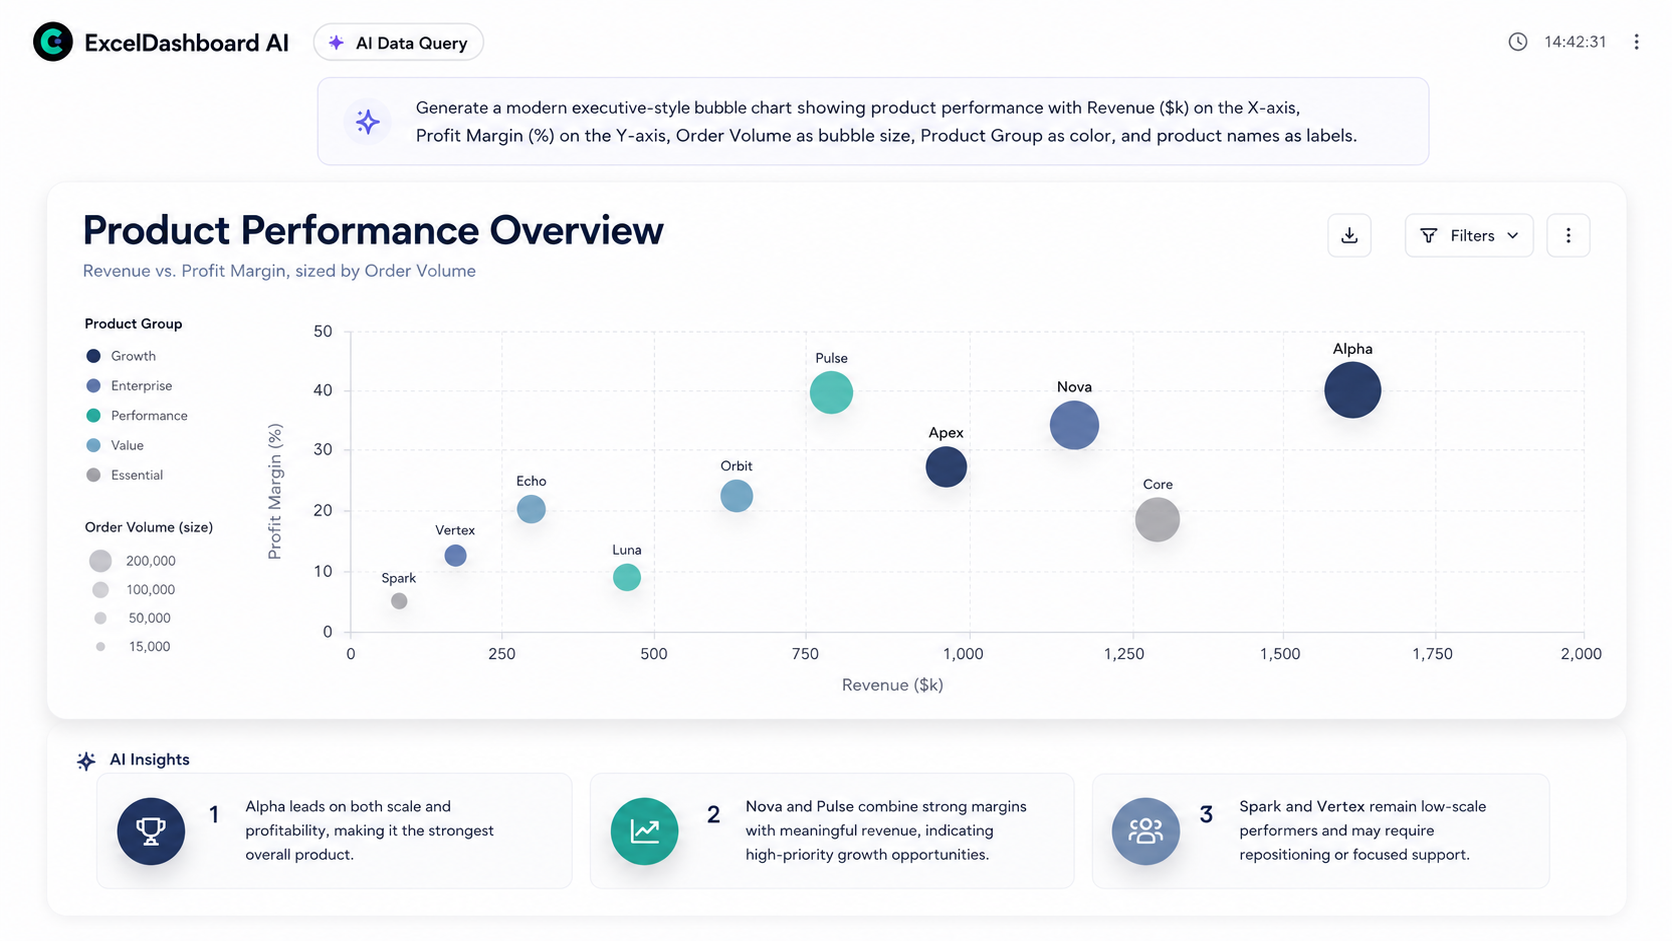
Upload your data or start with a question. Let AI create the finished deliverable.
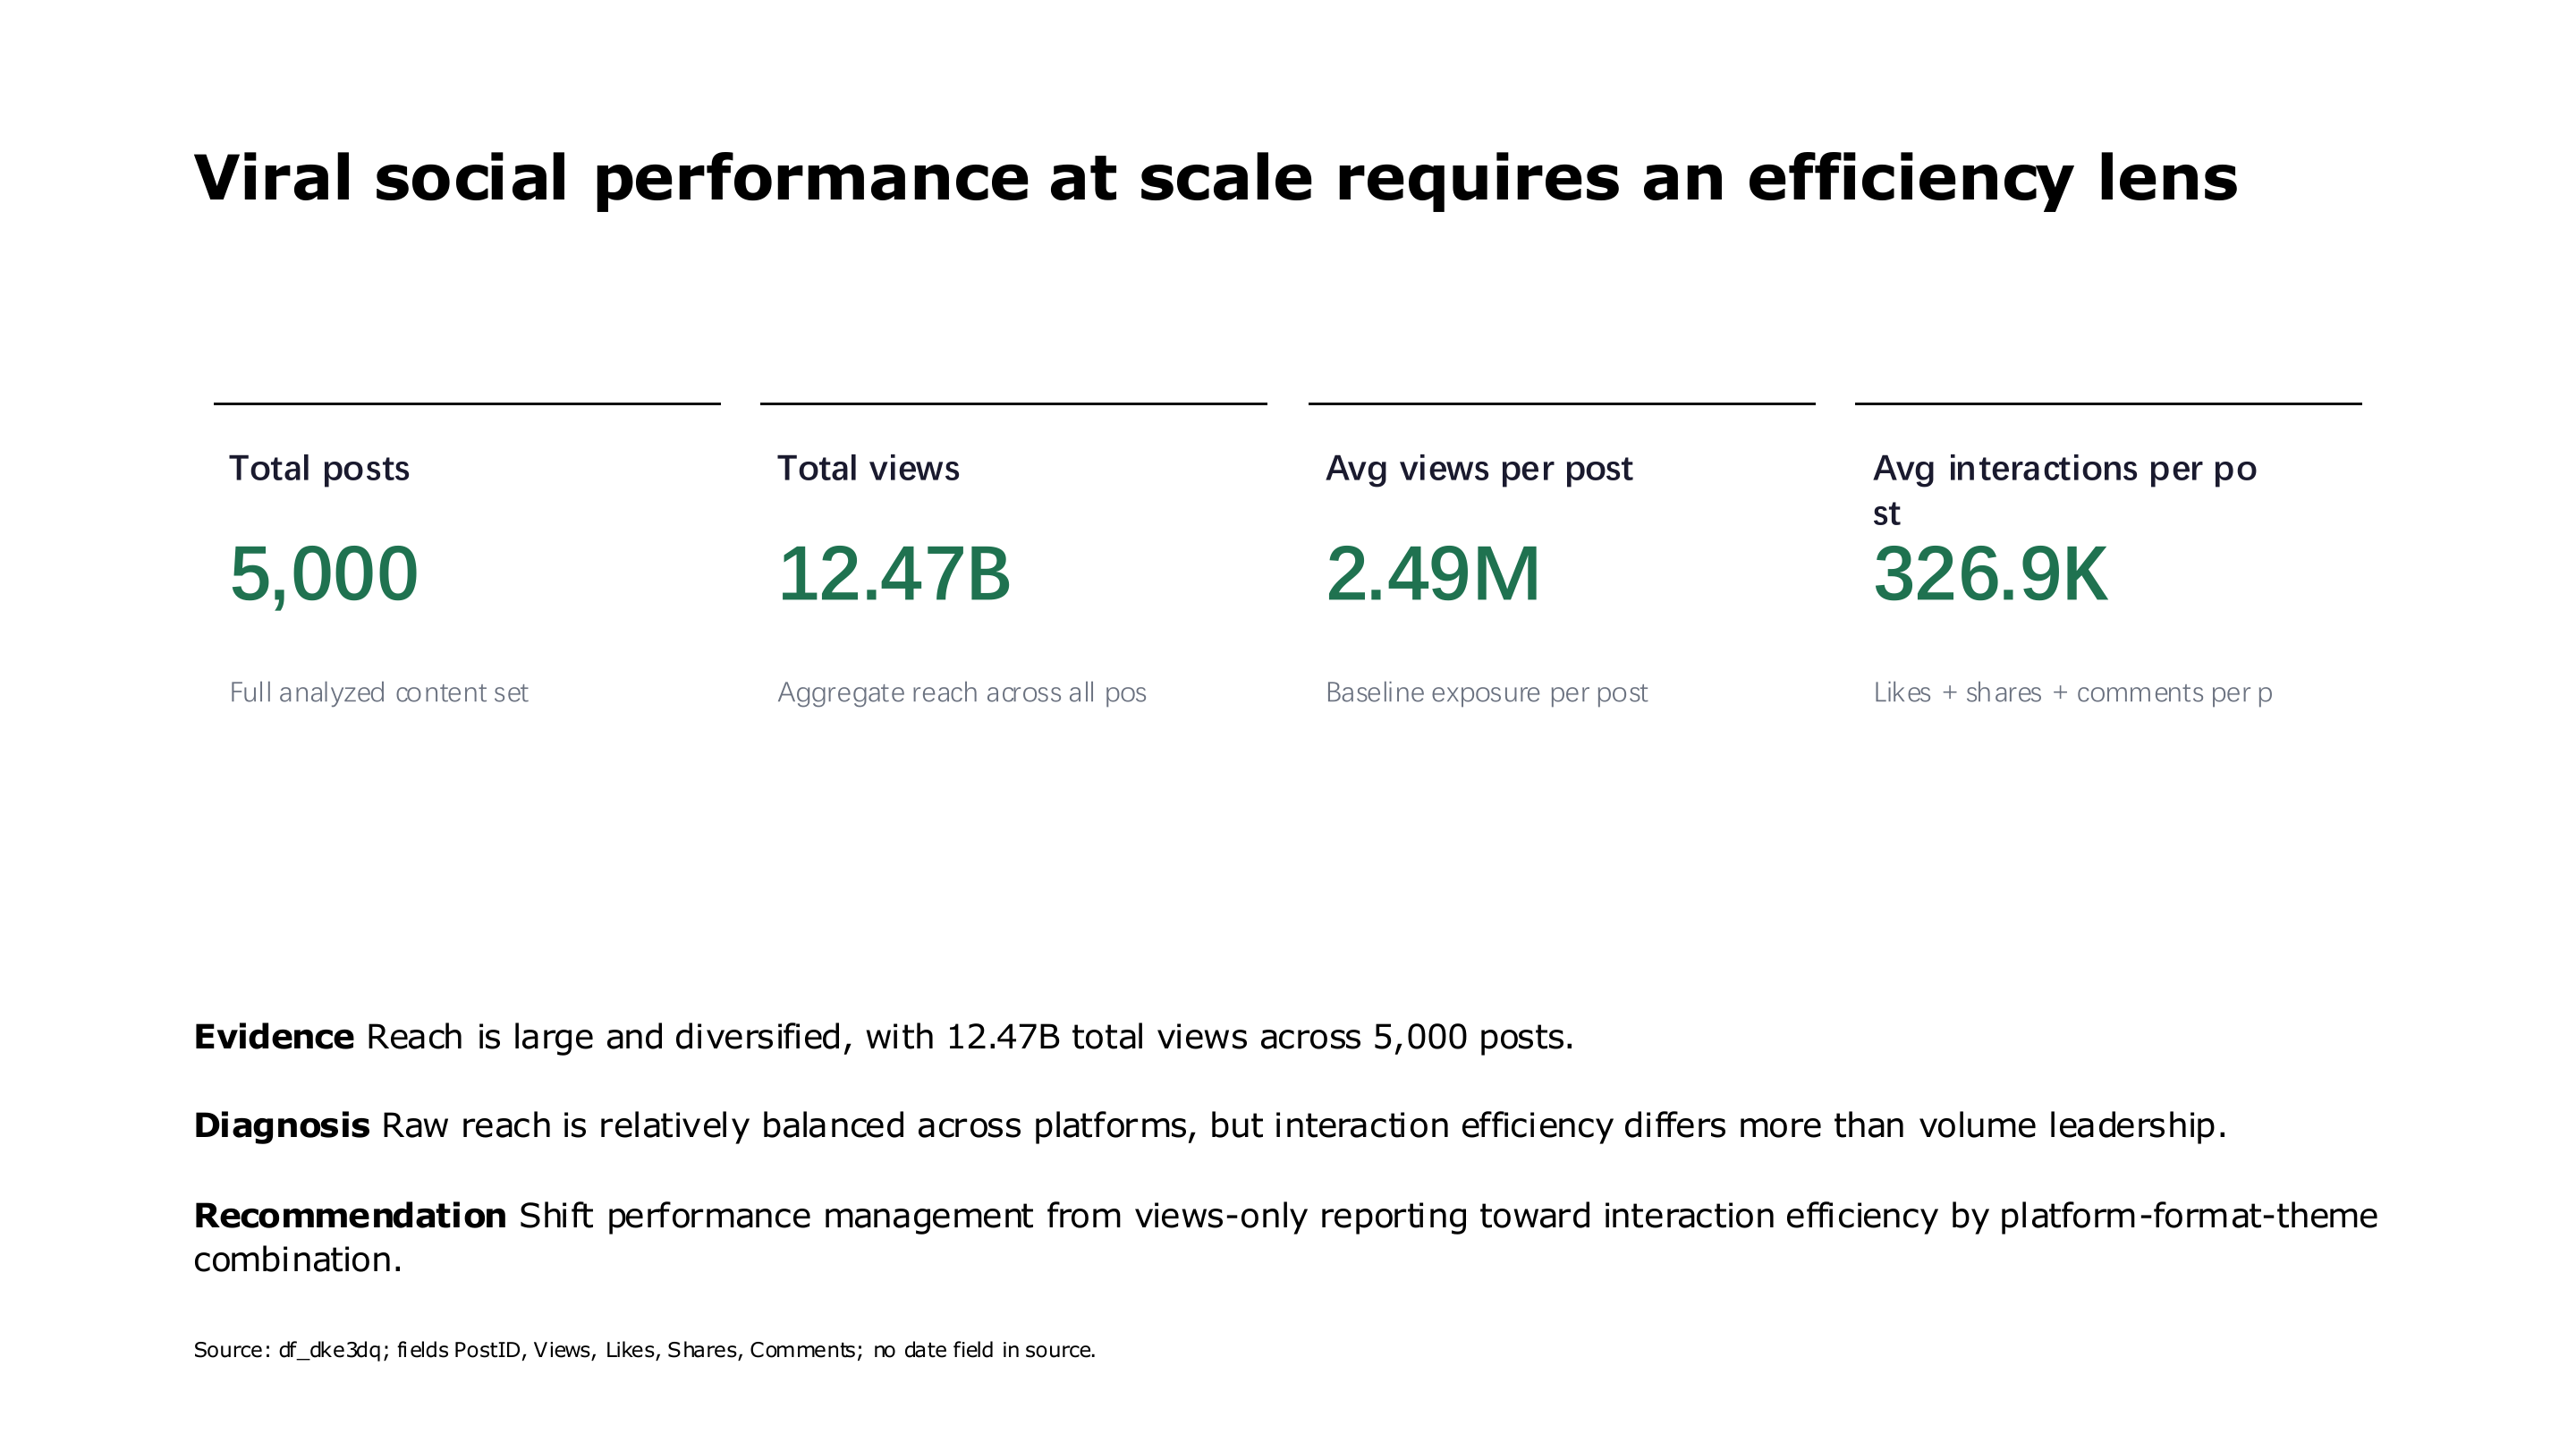
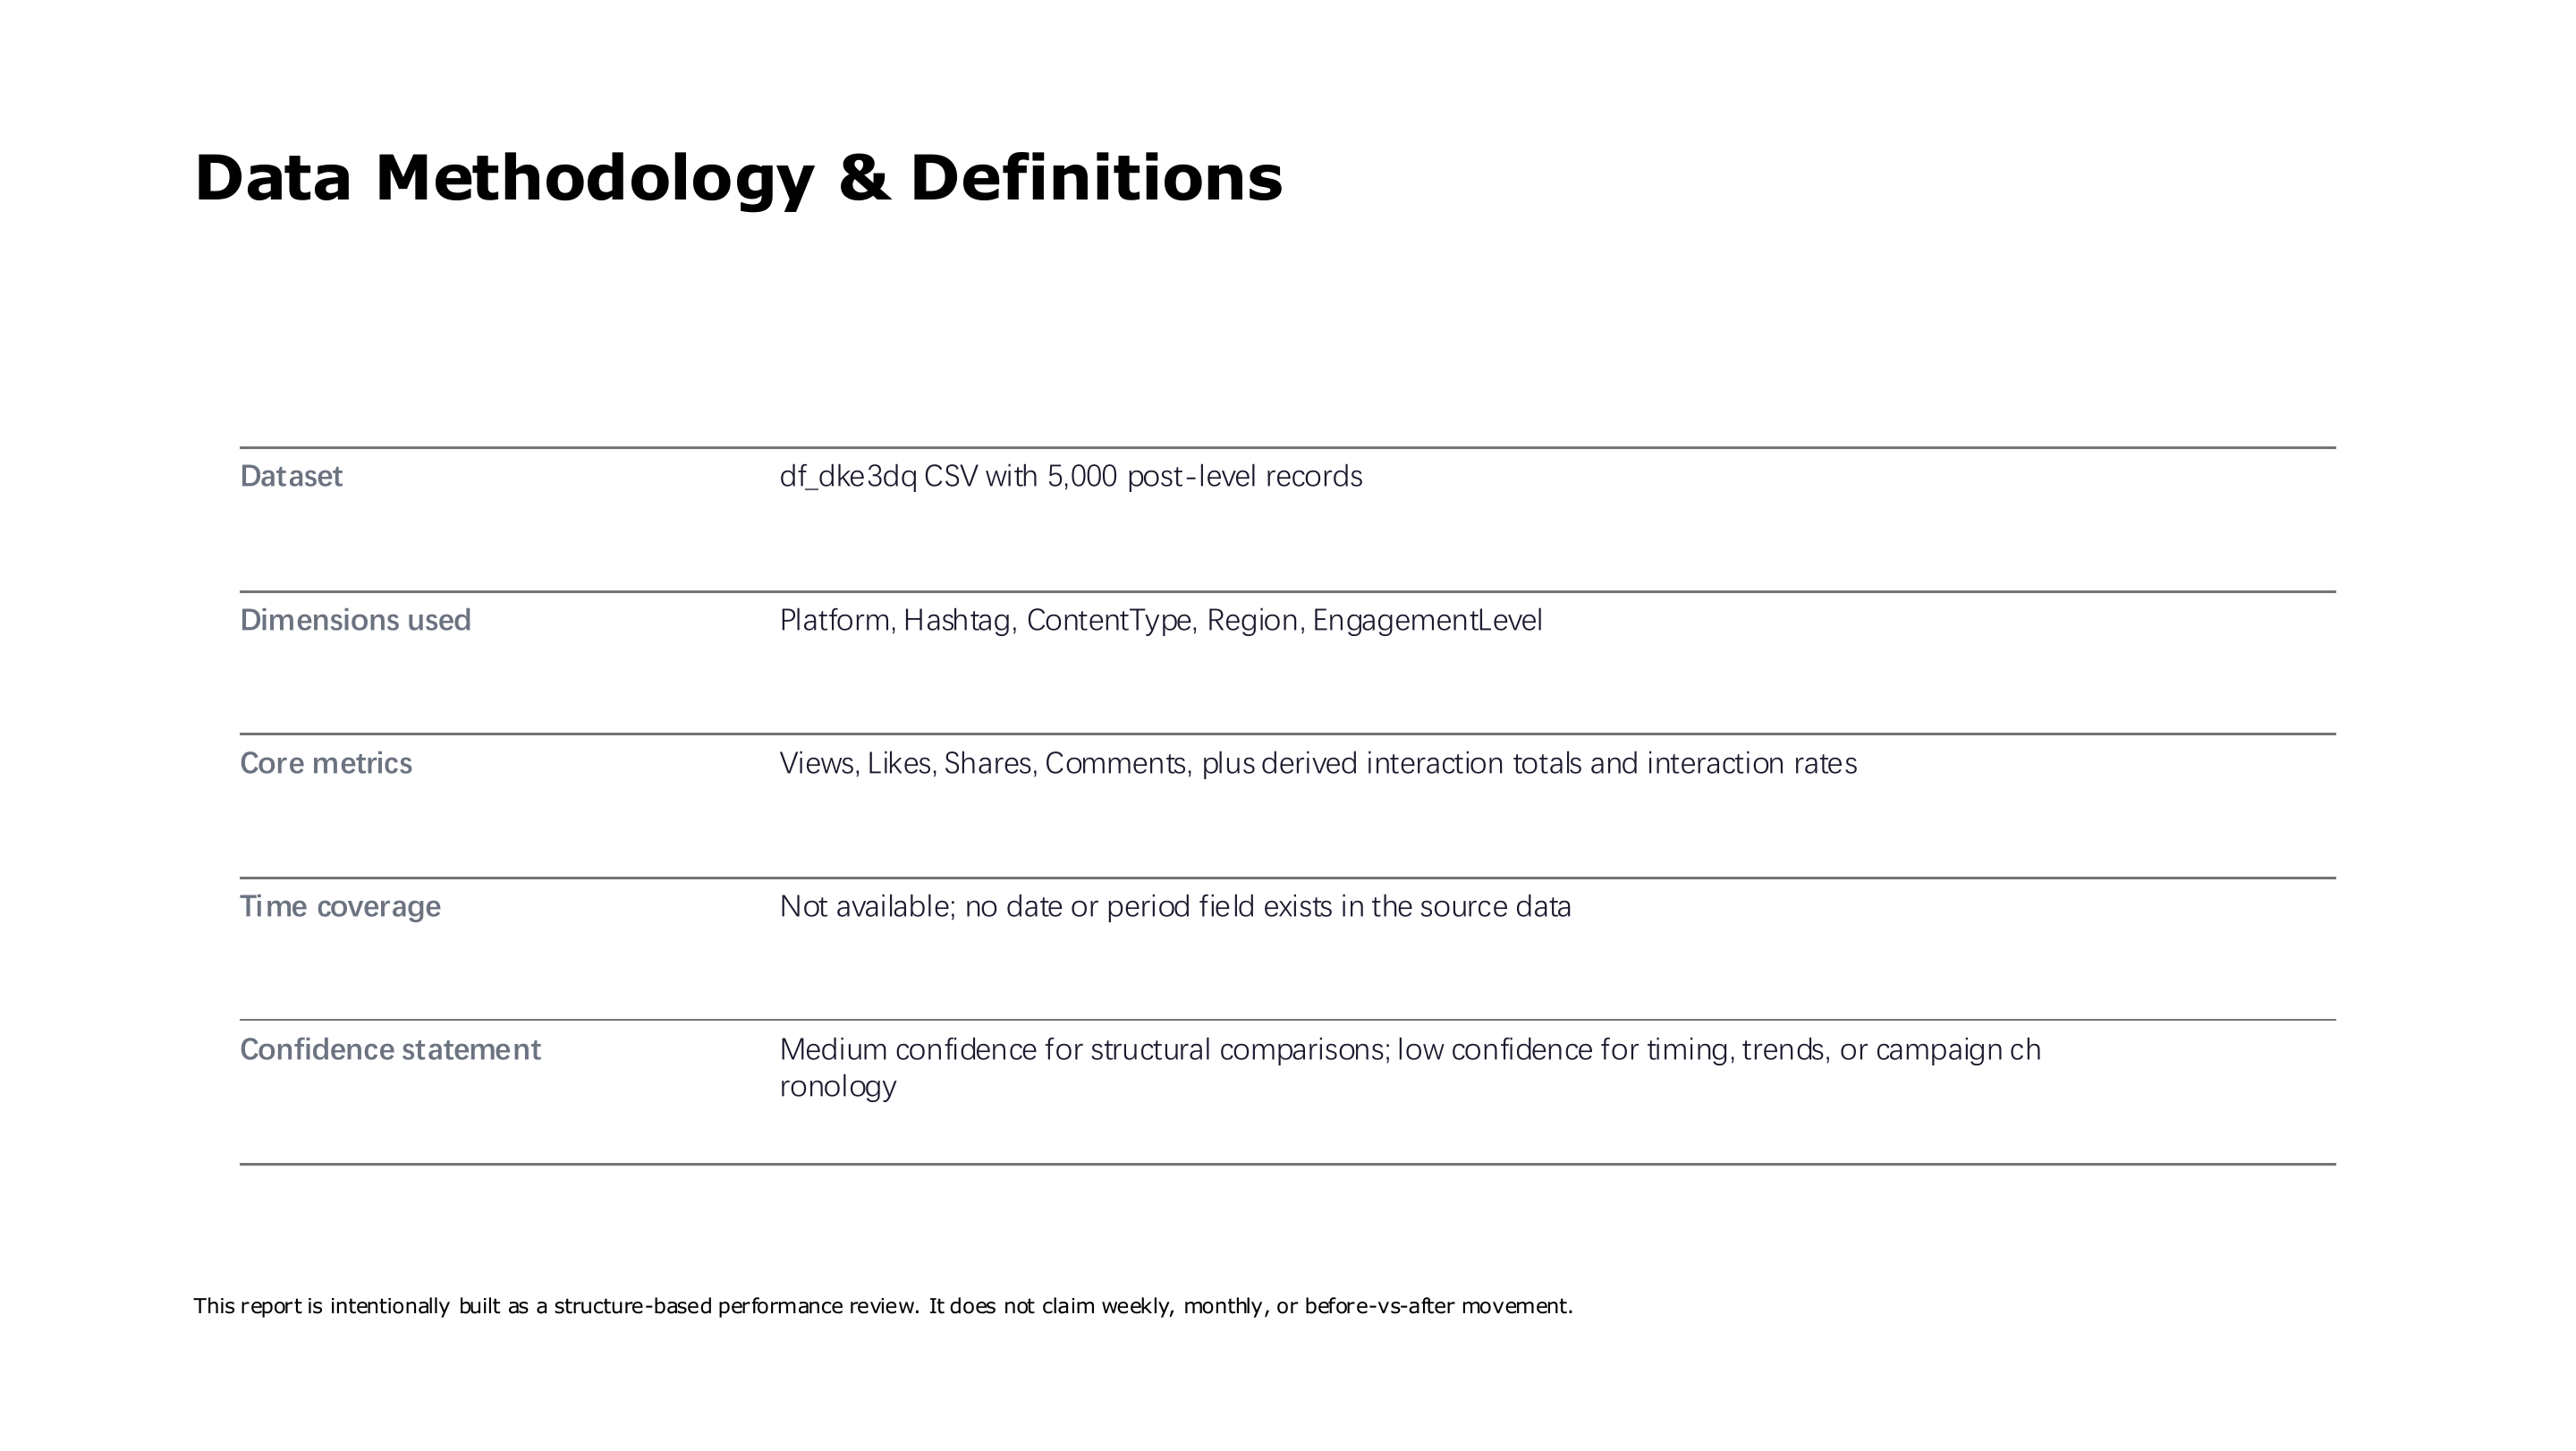
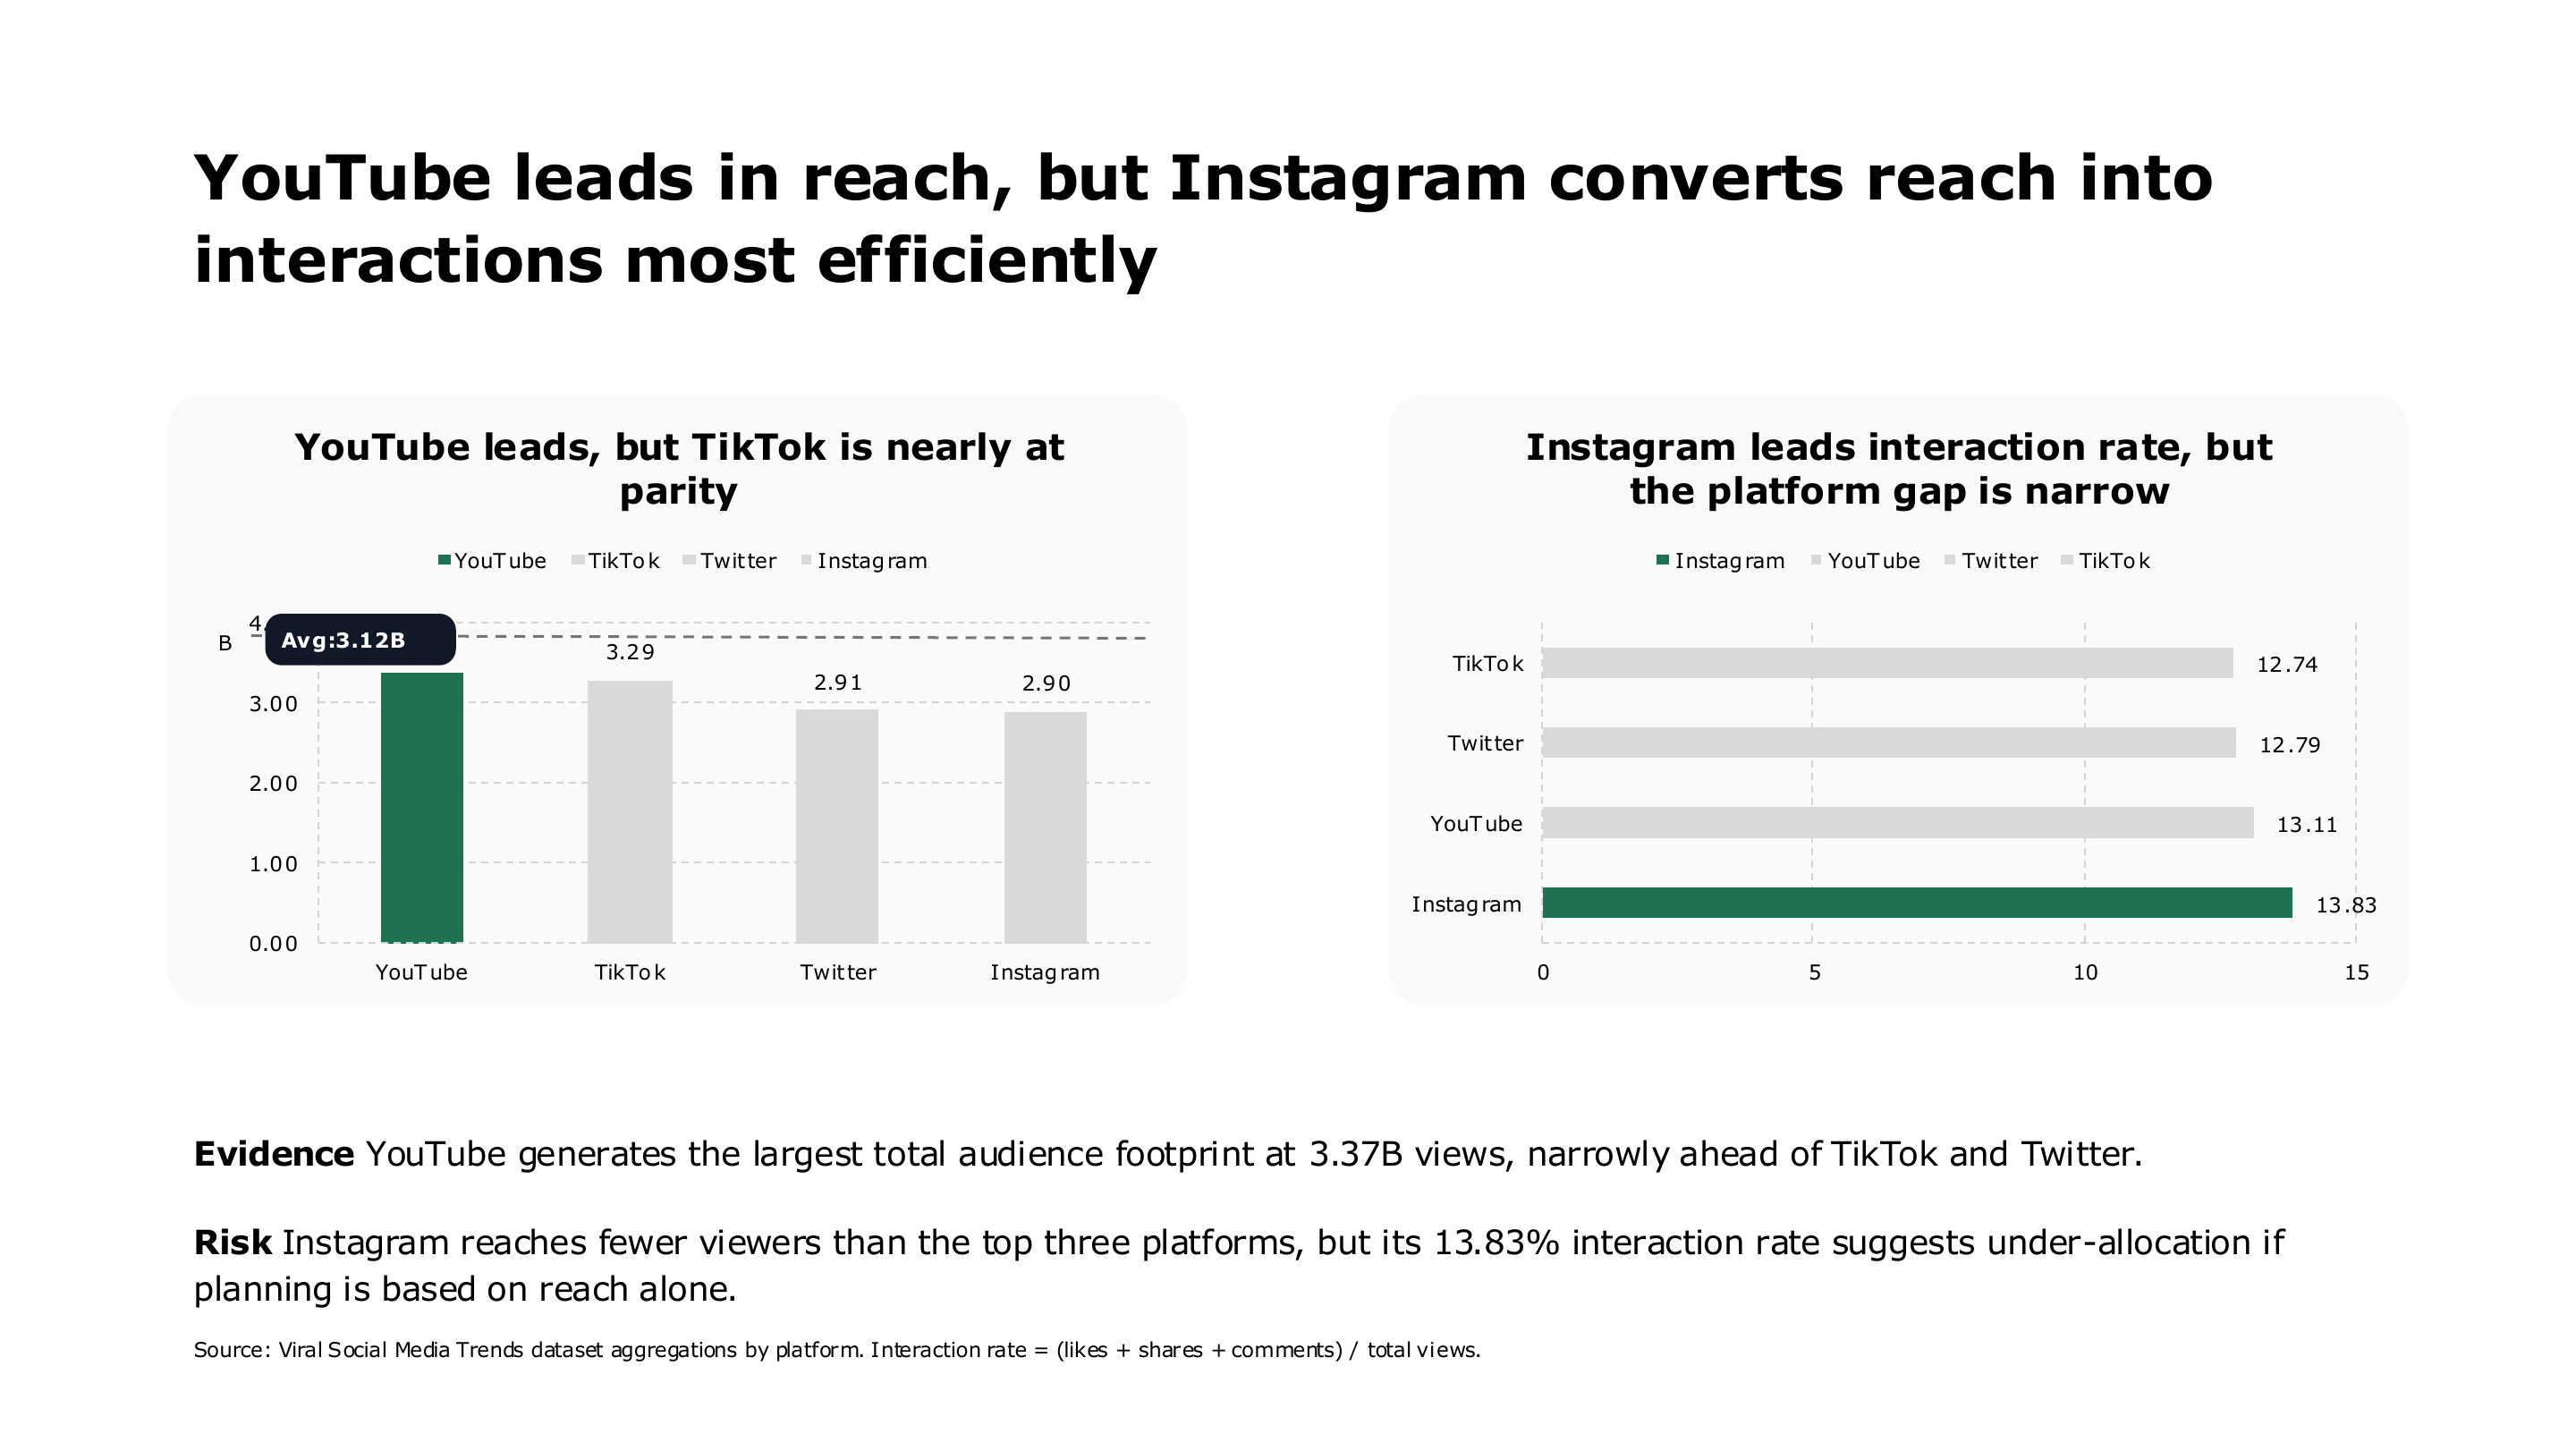
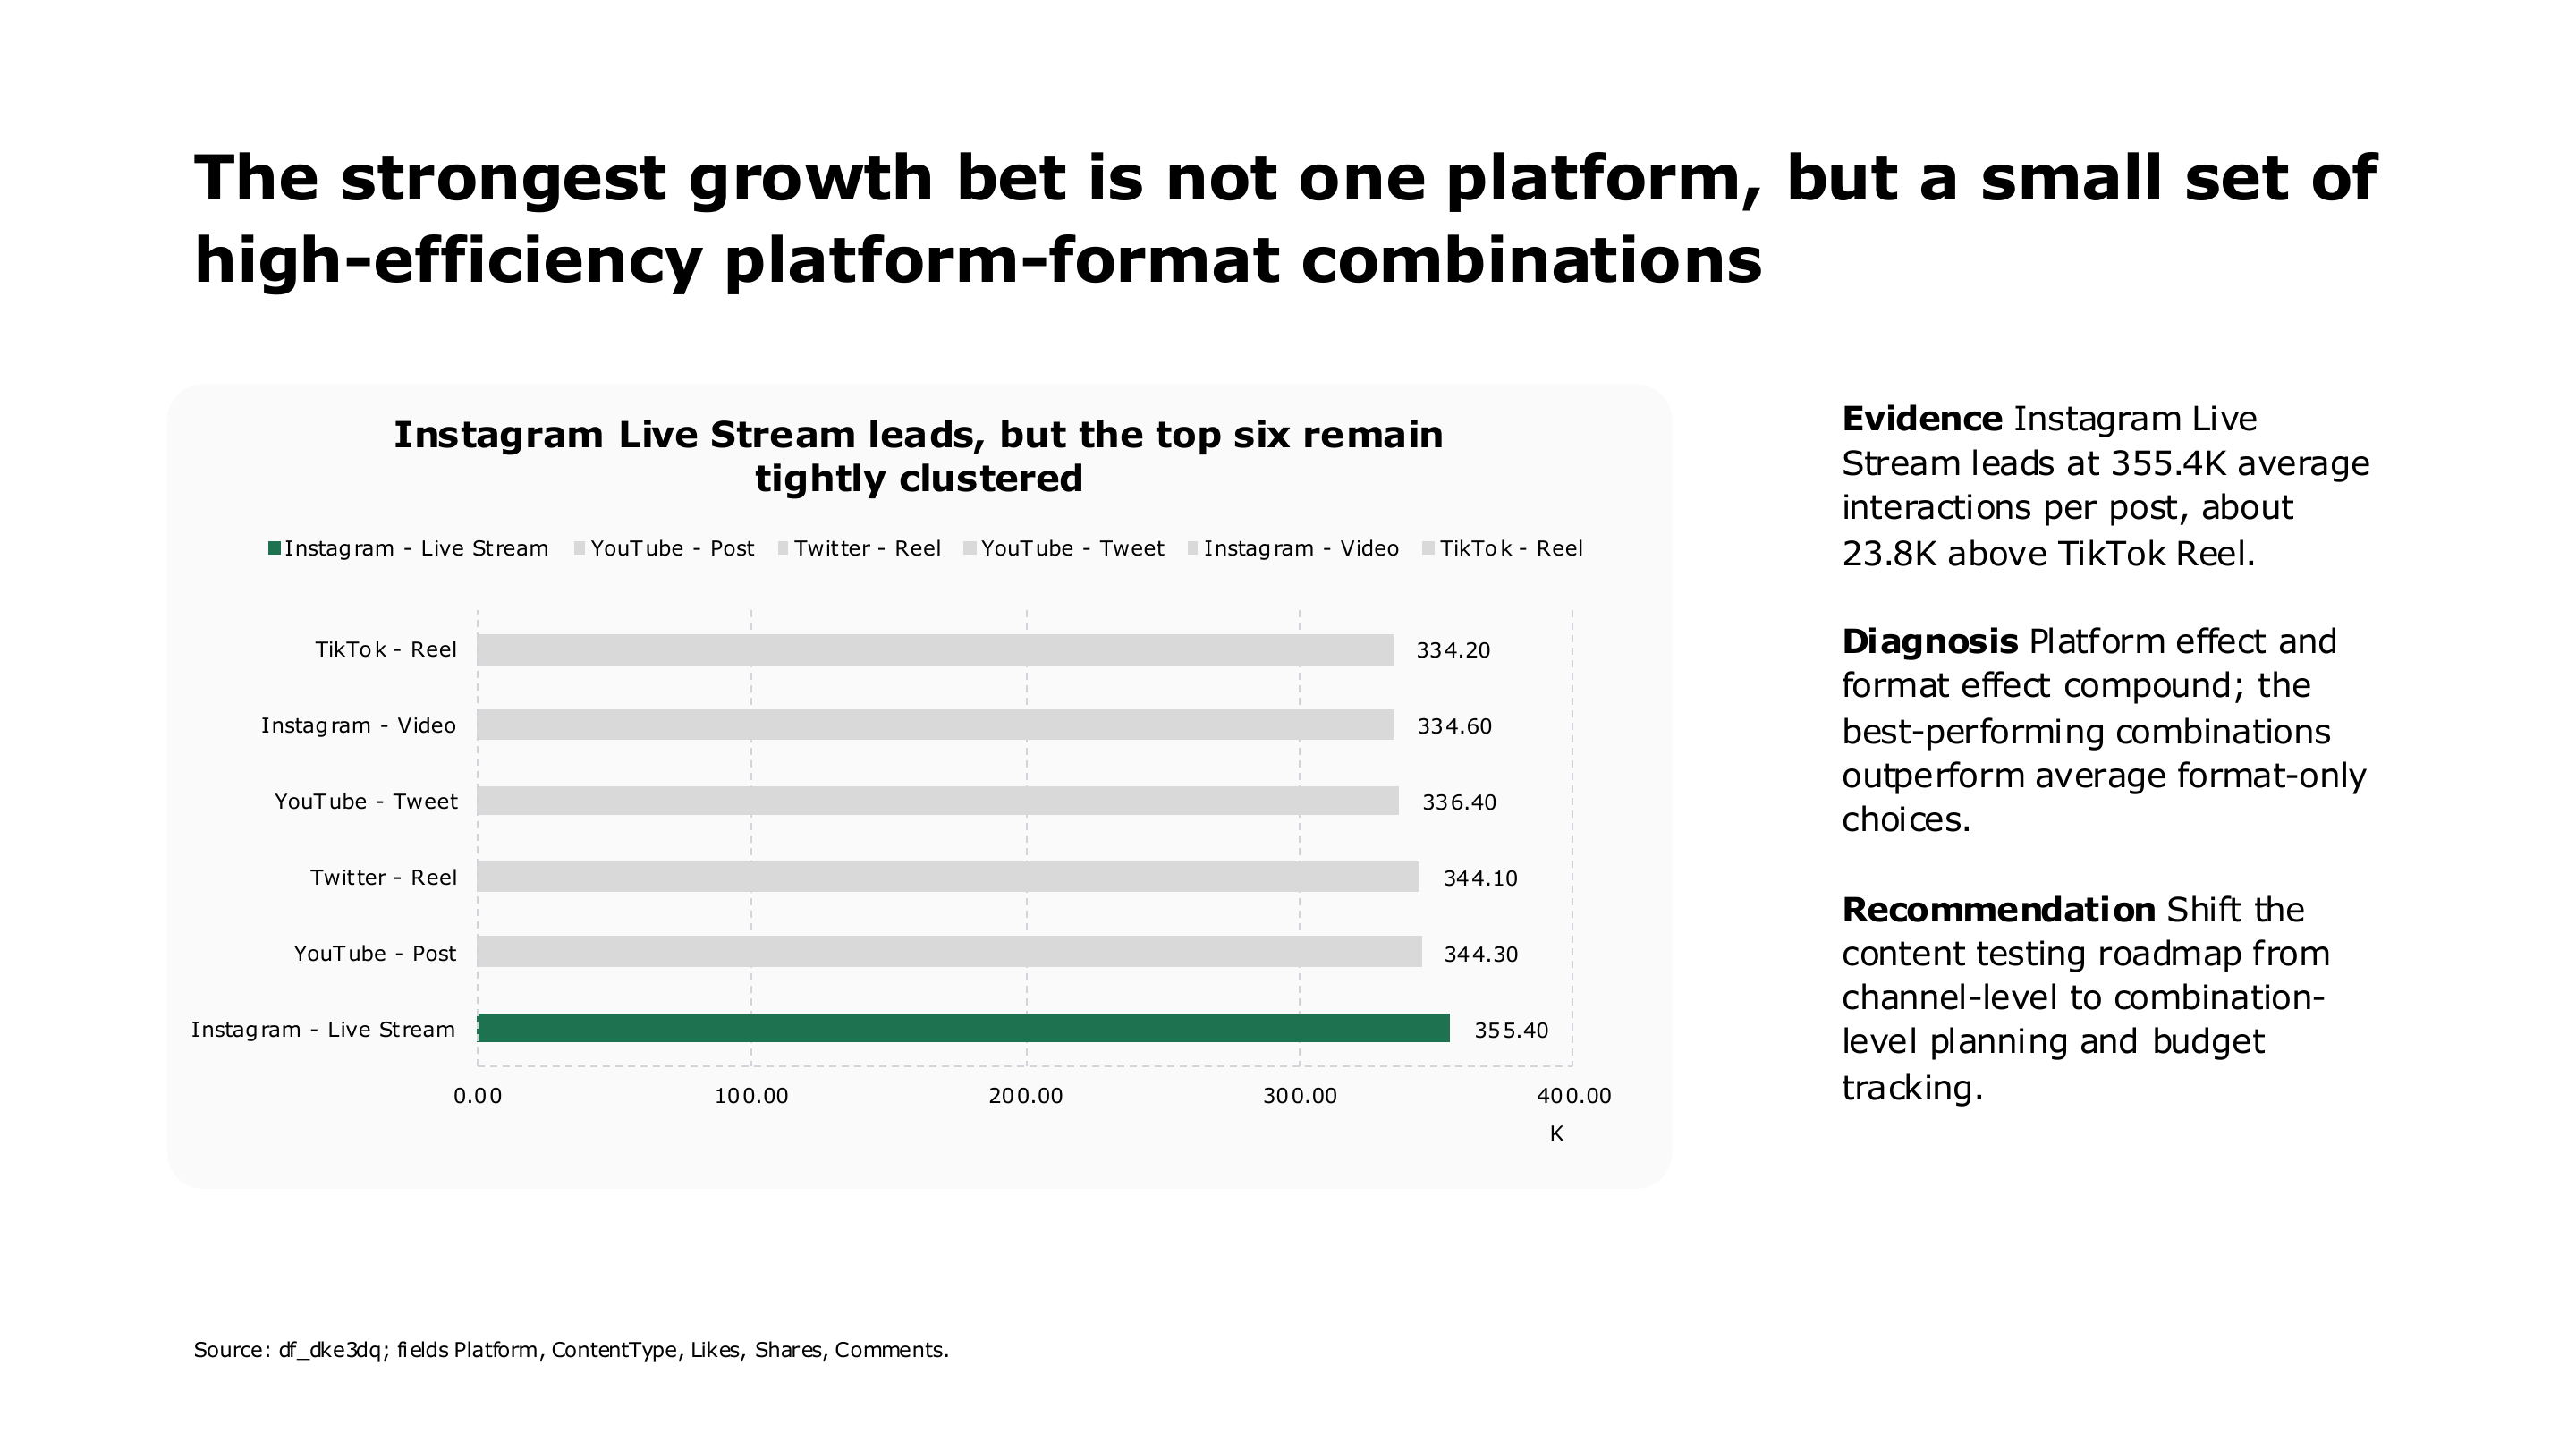
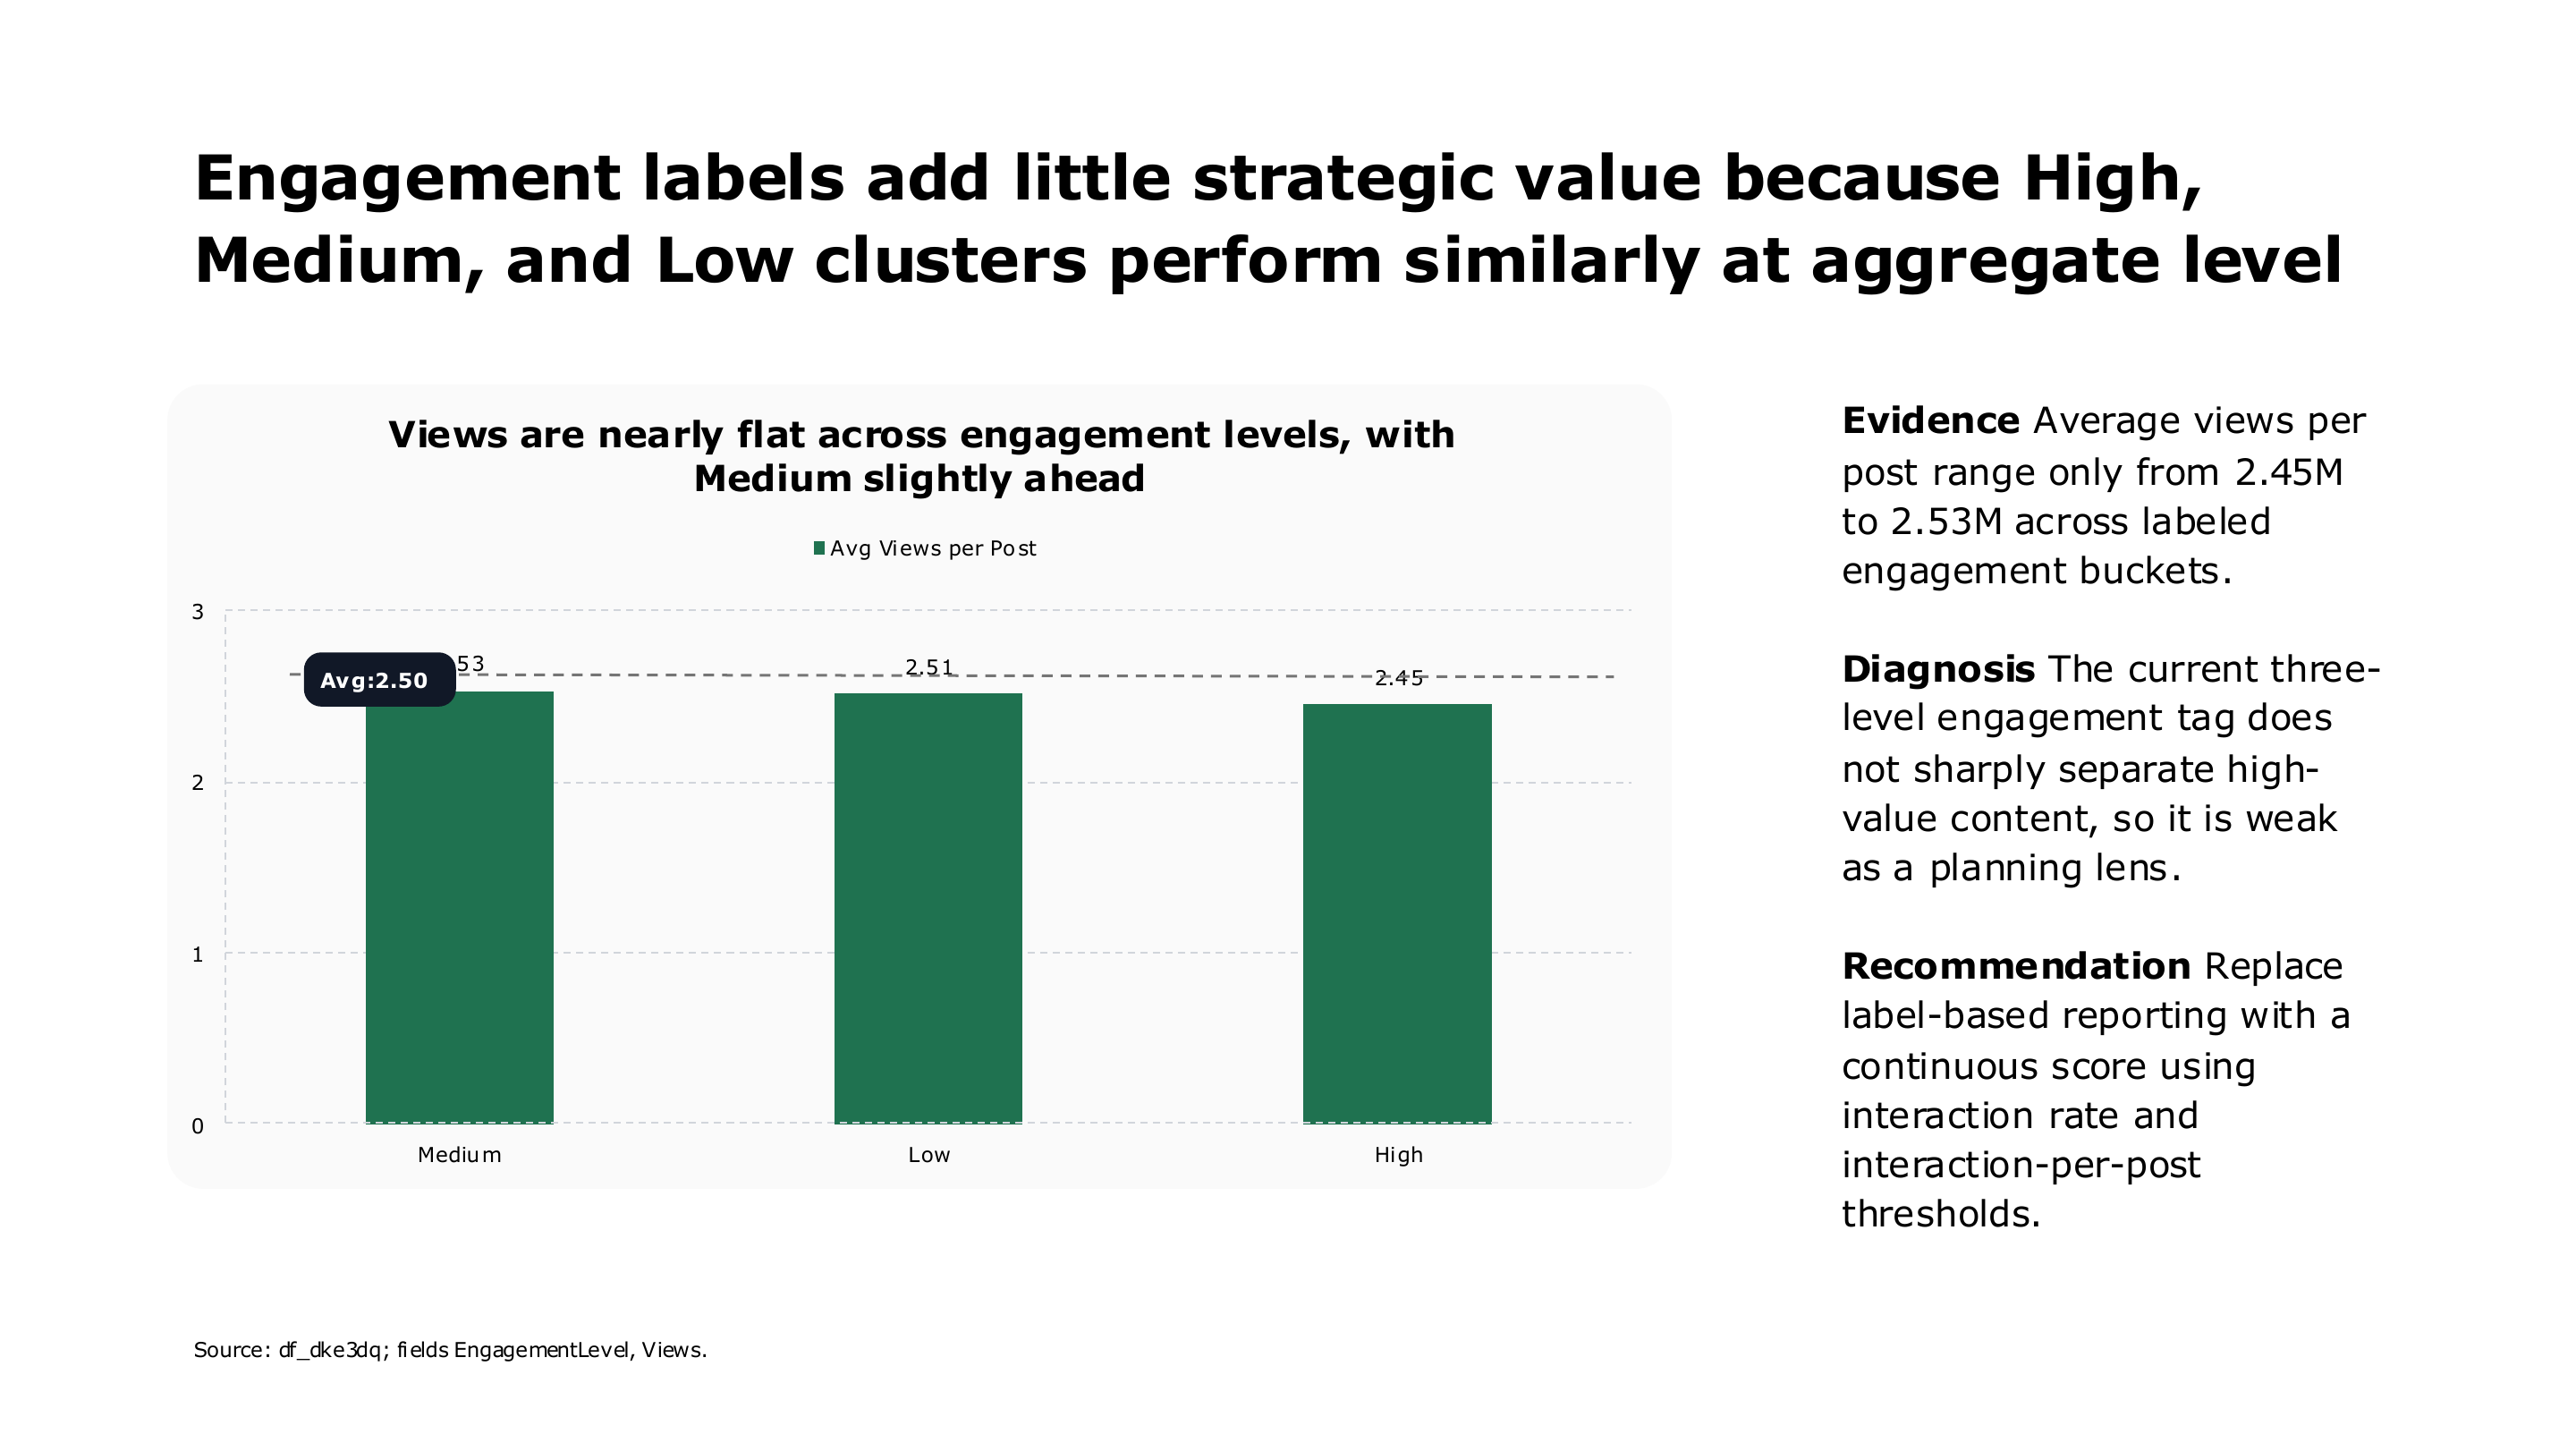
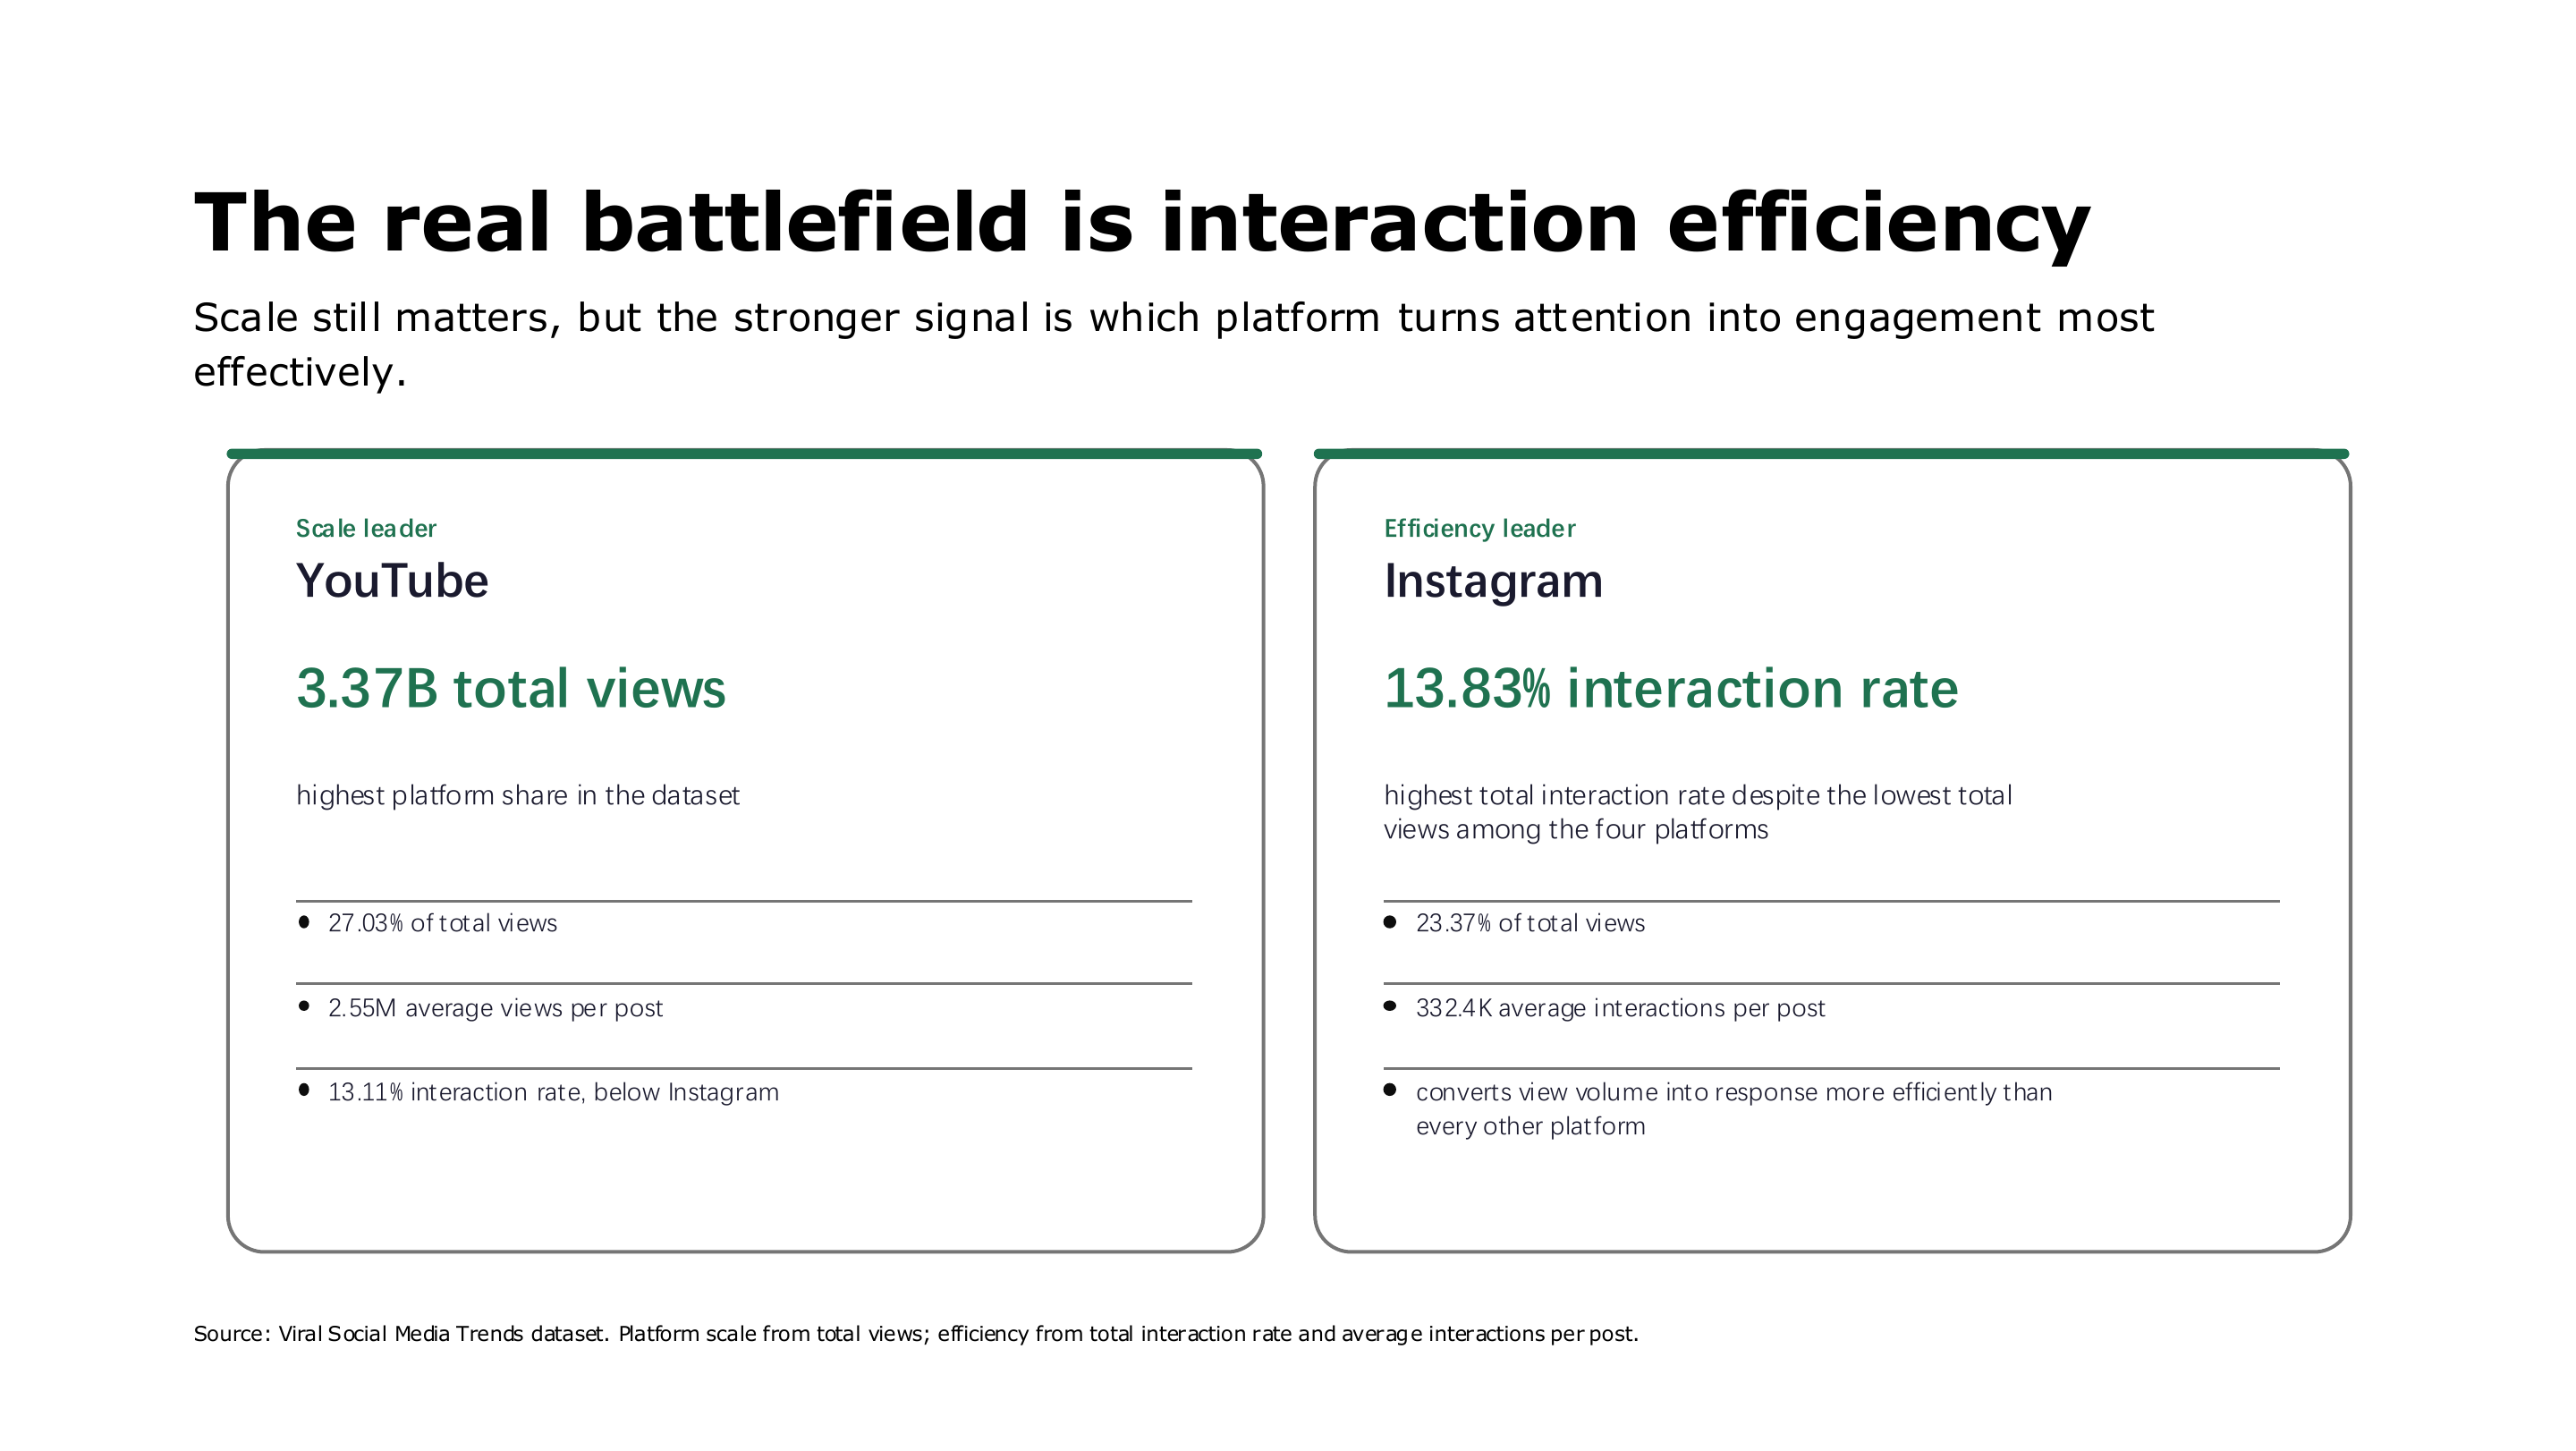
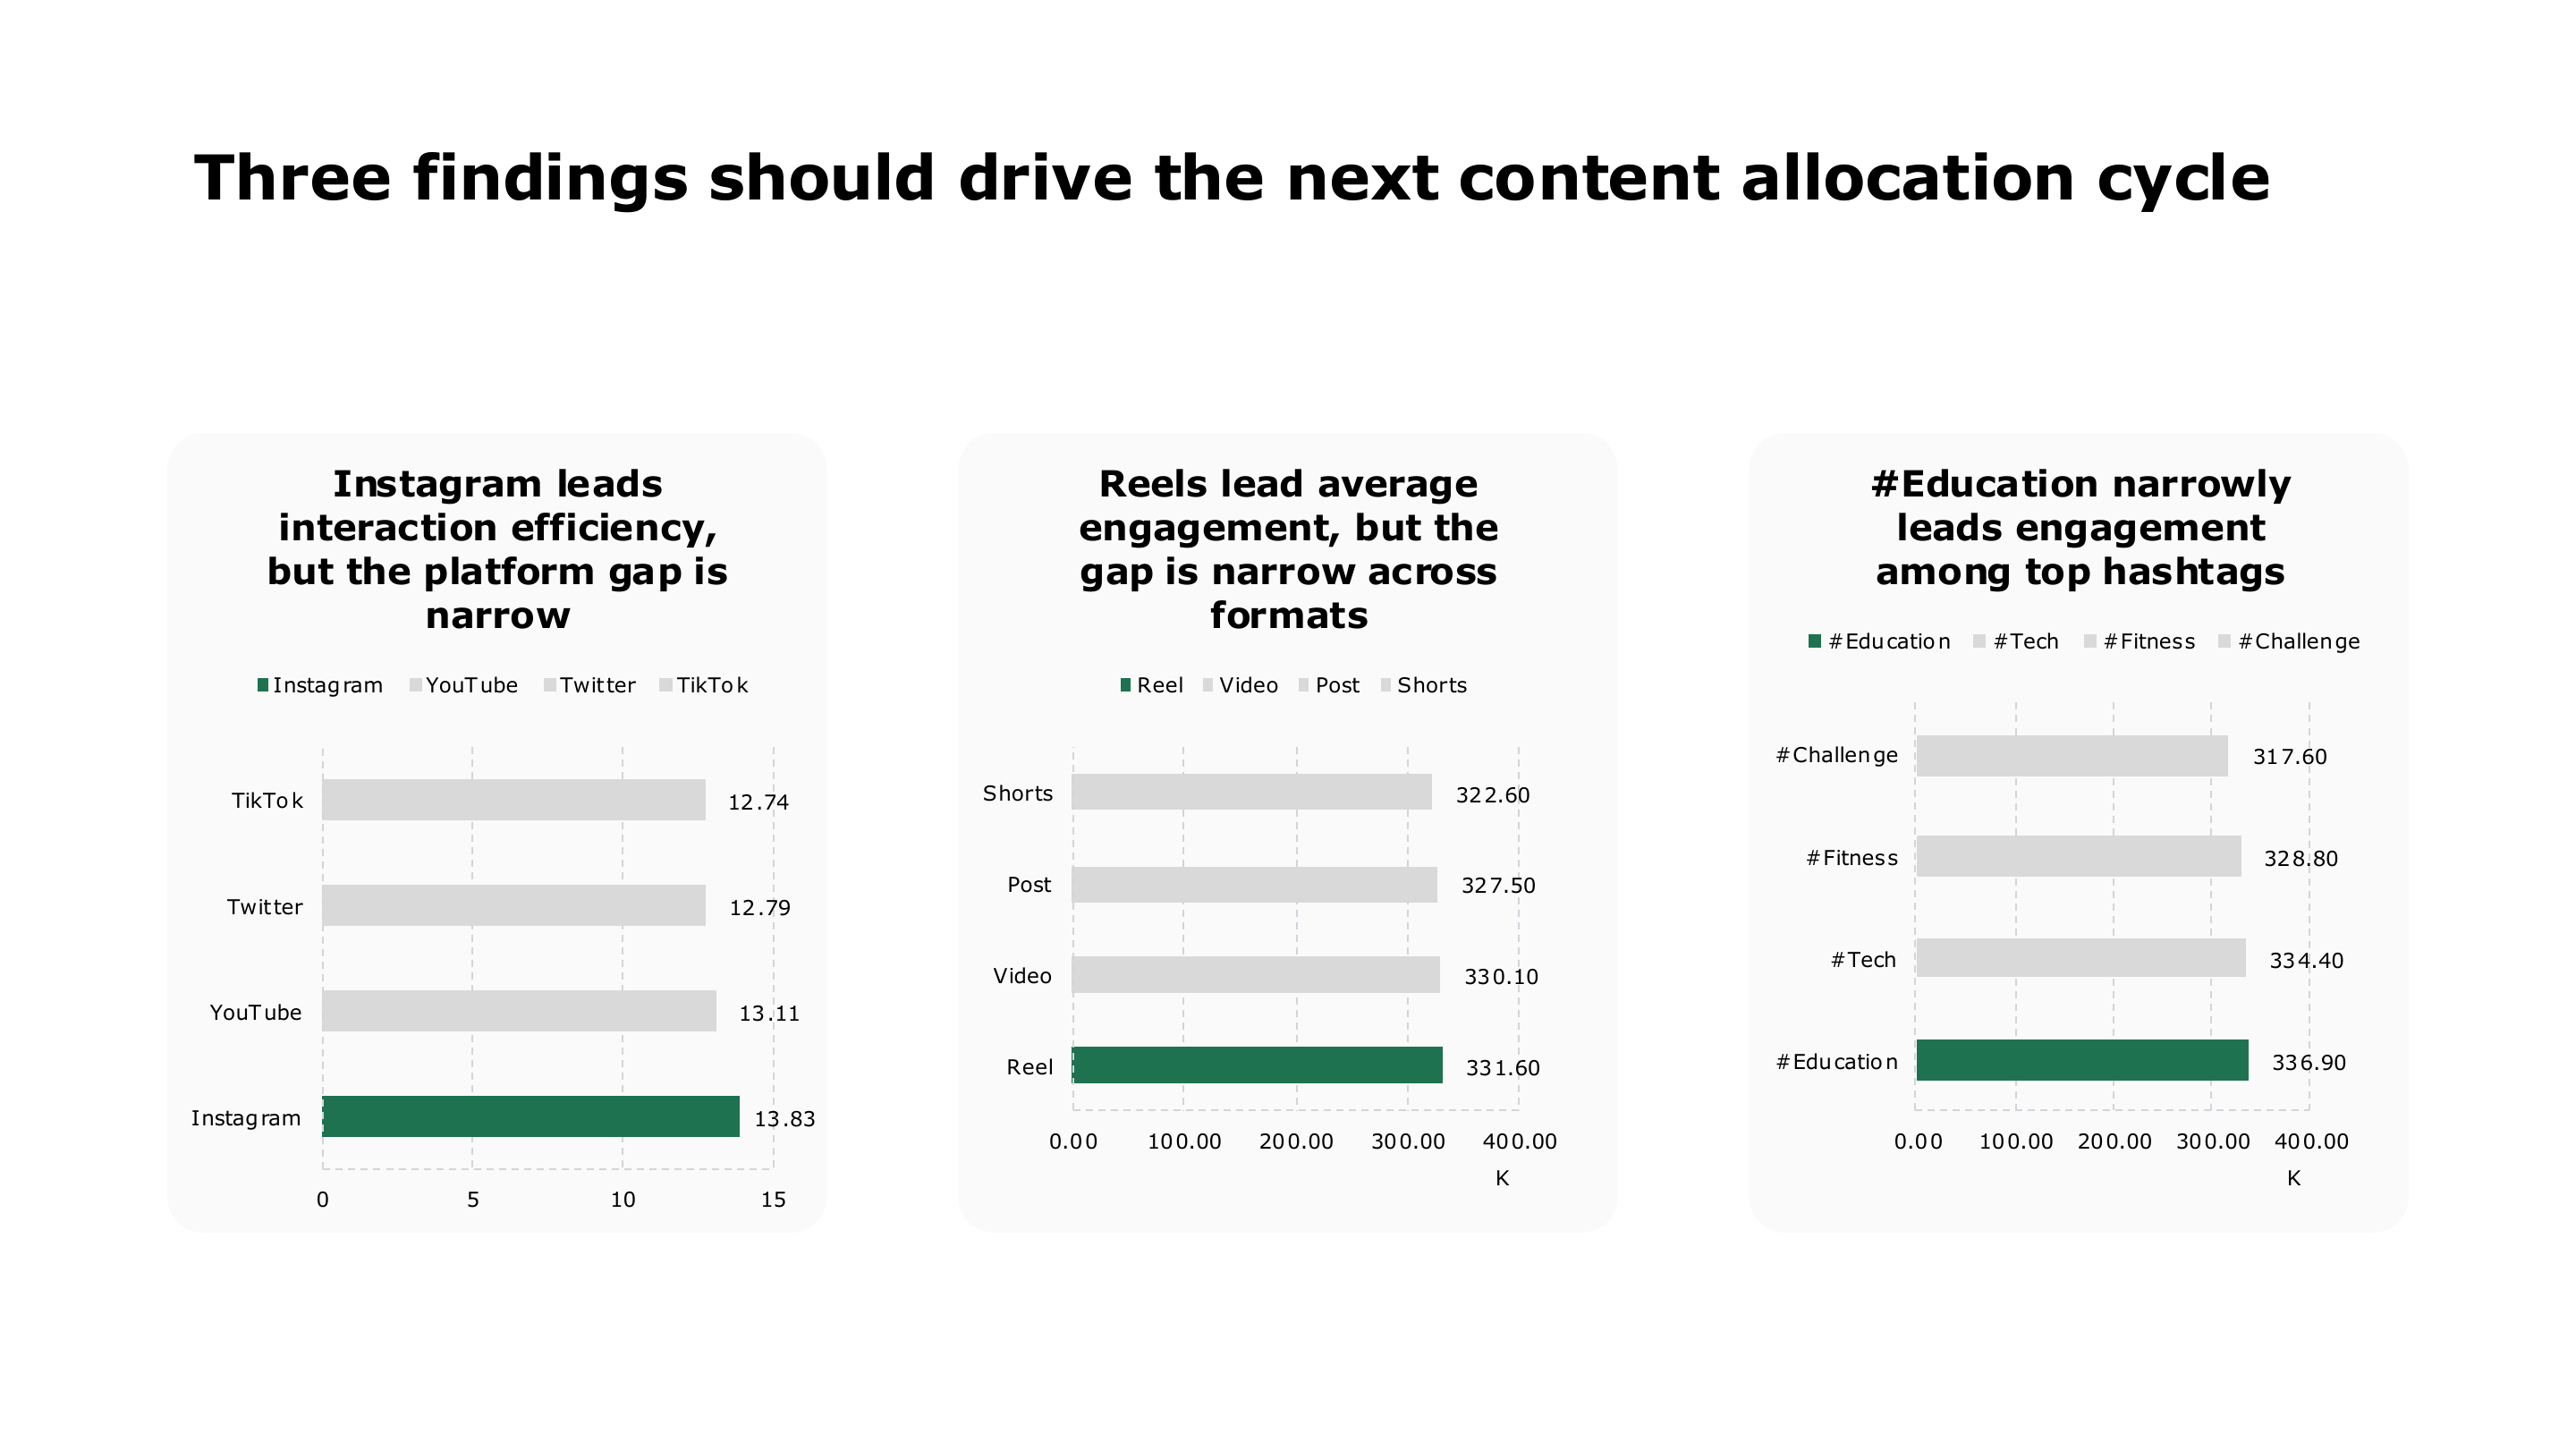
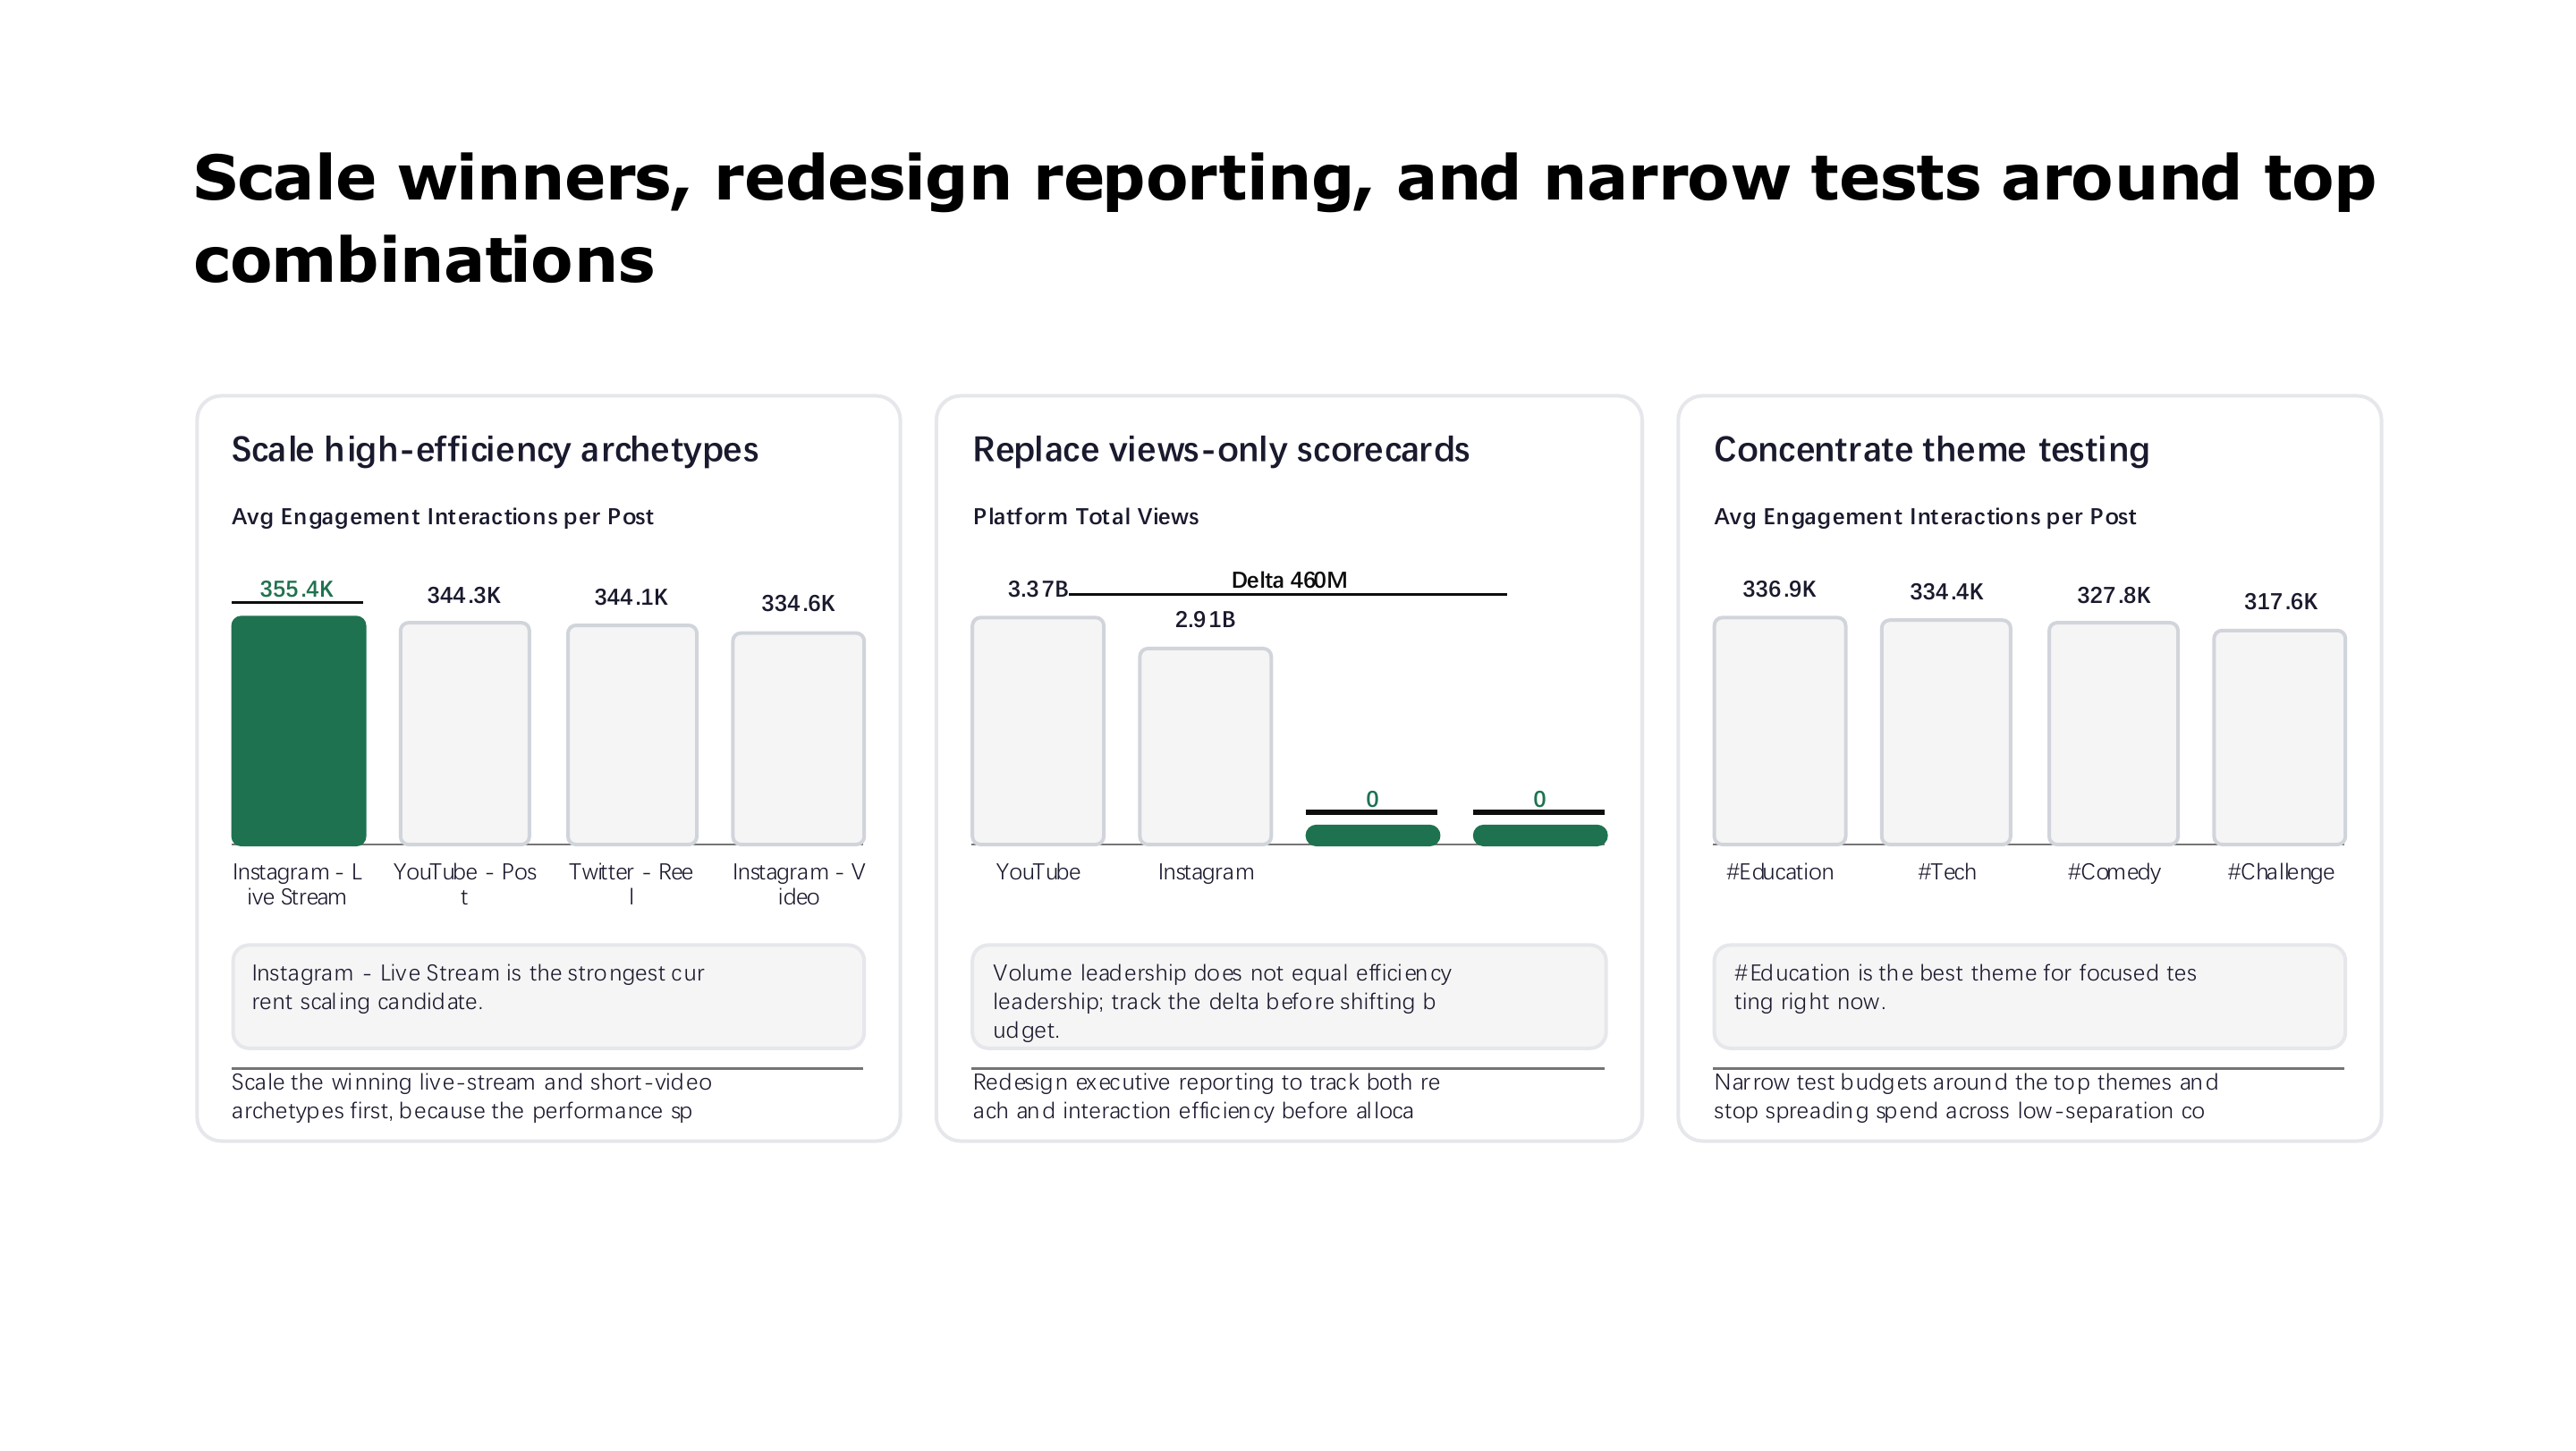
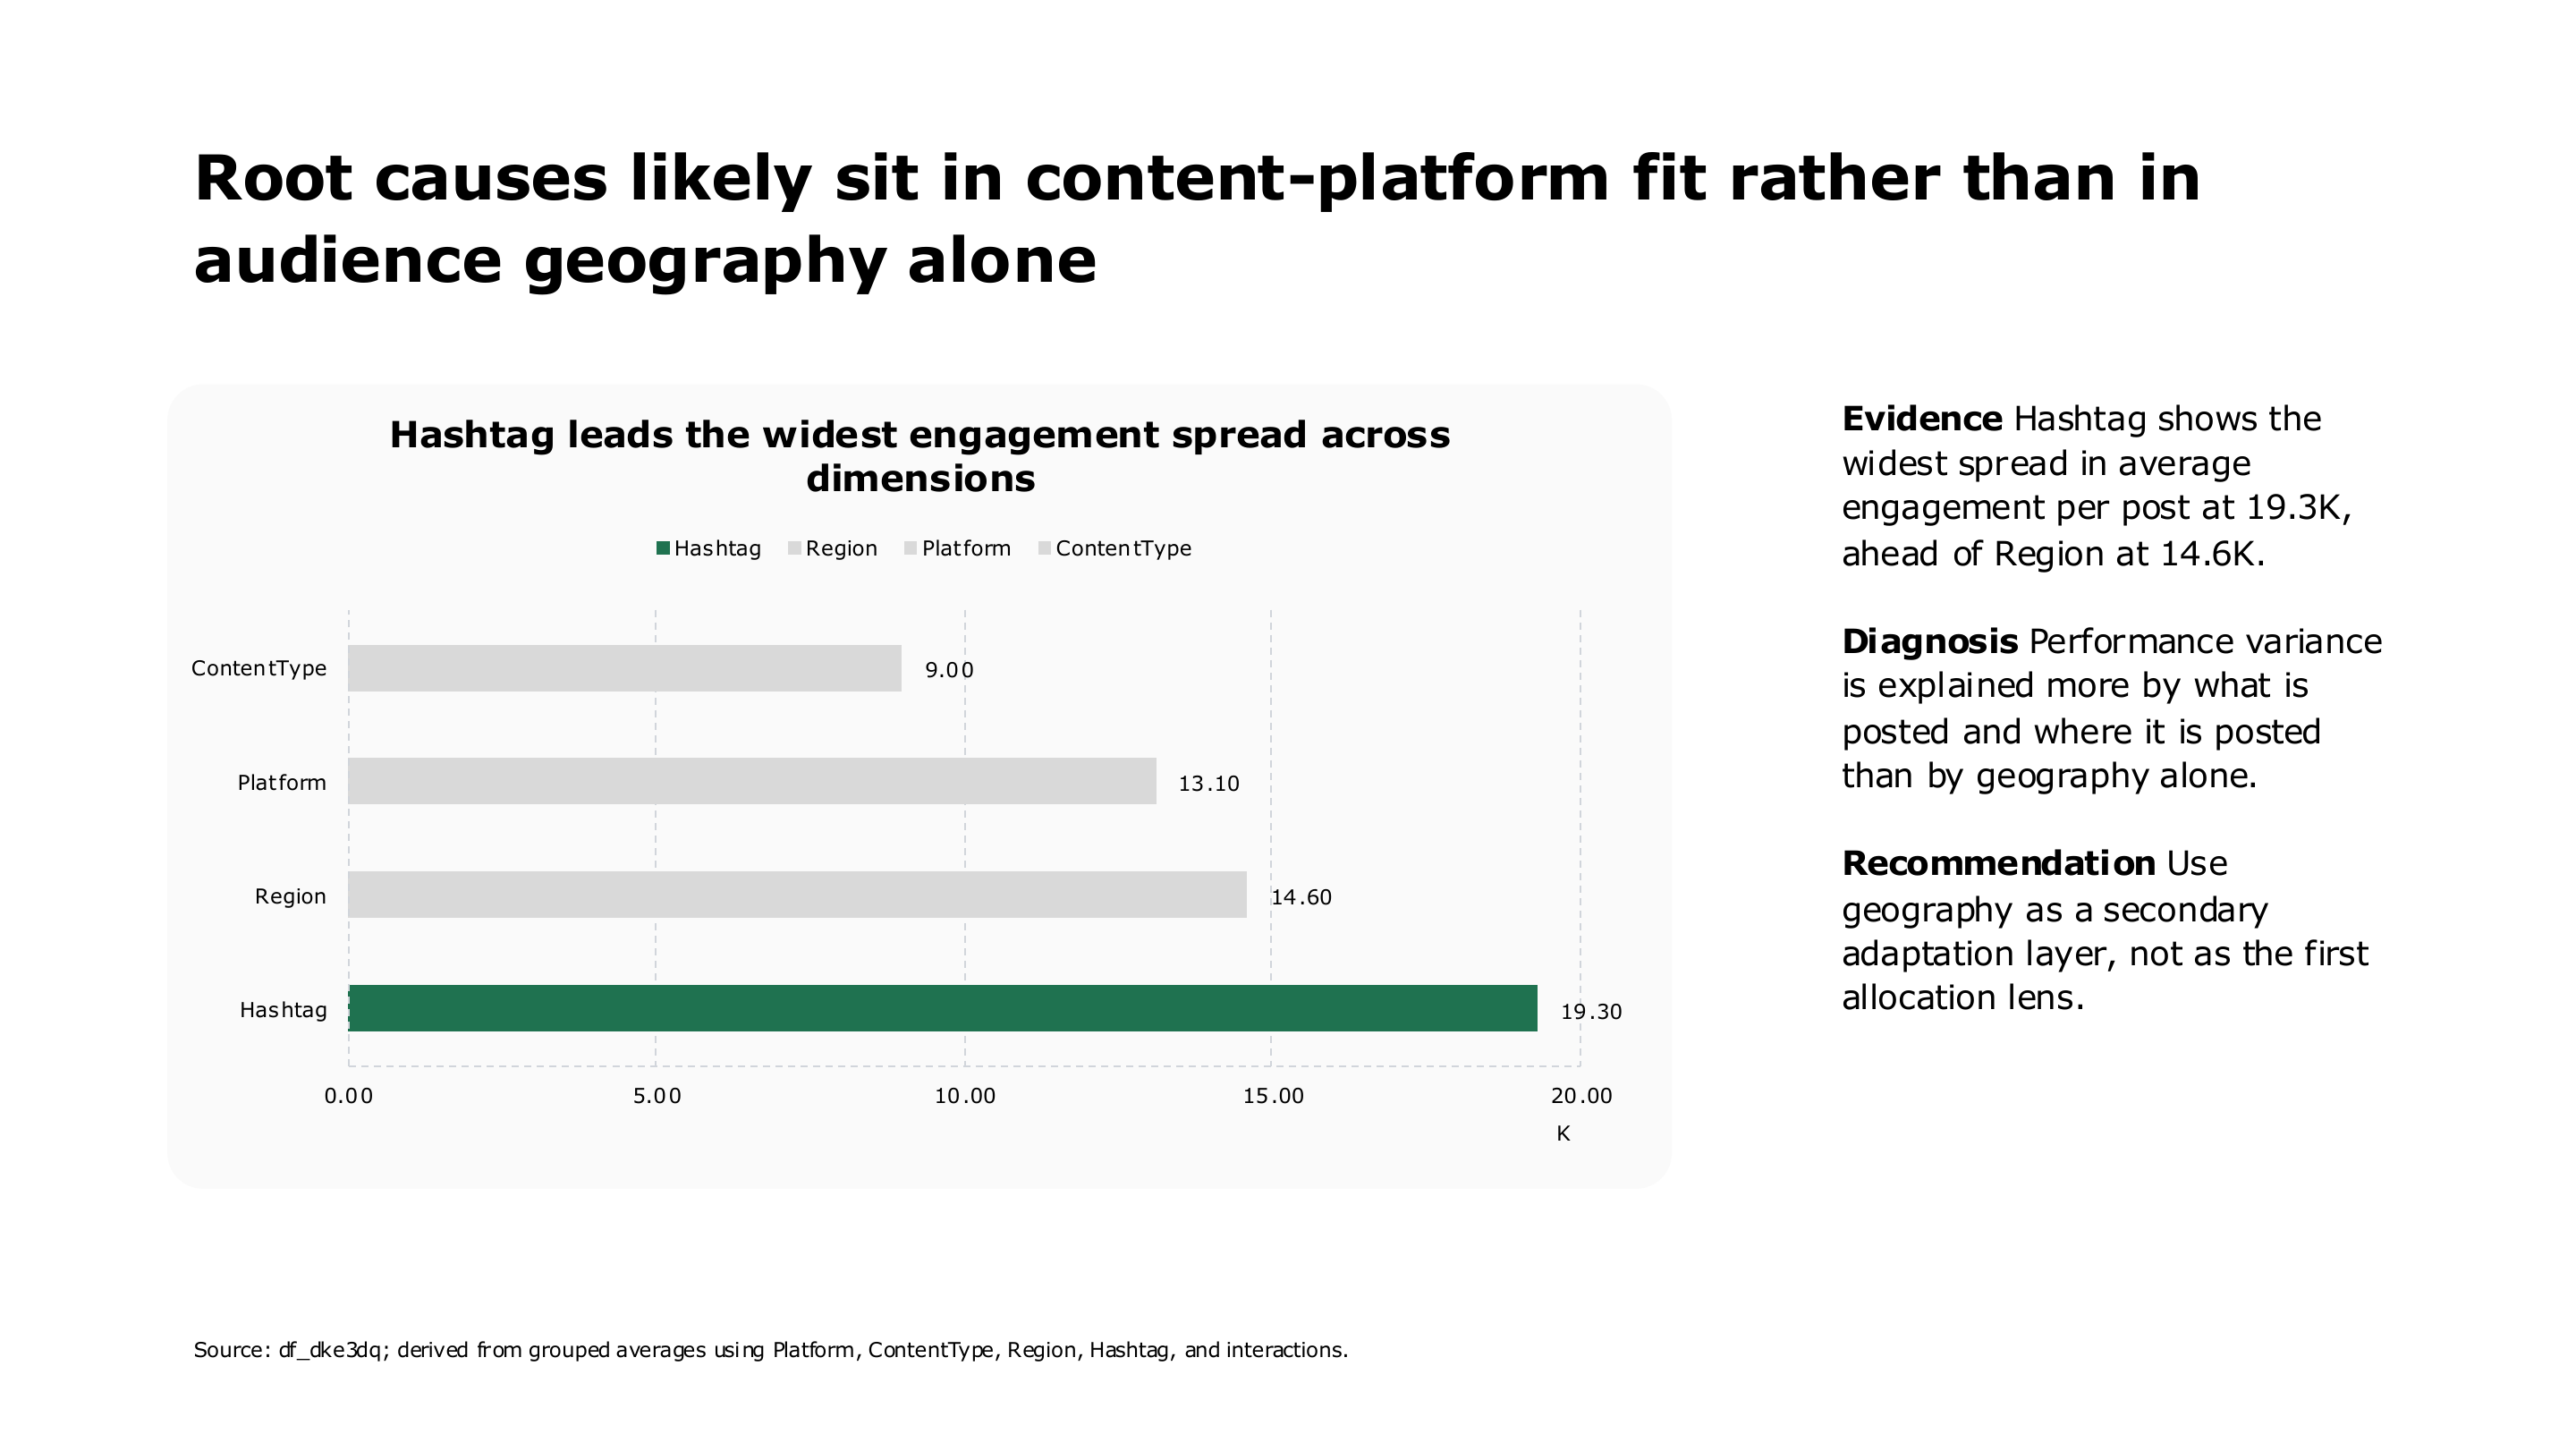
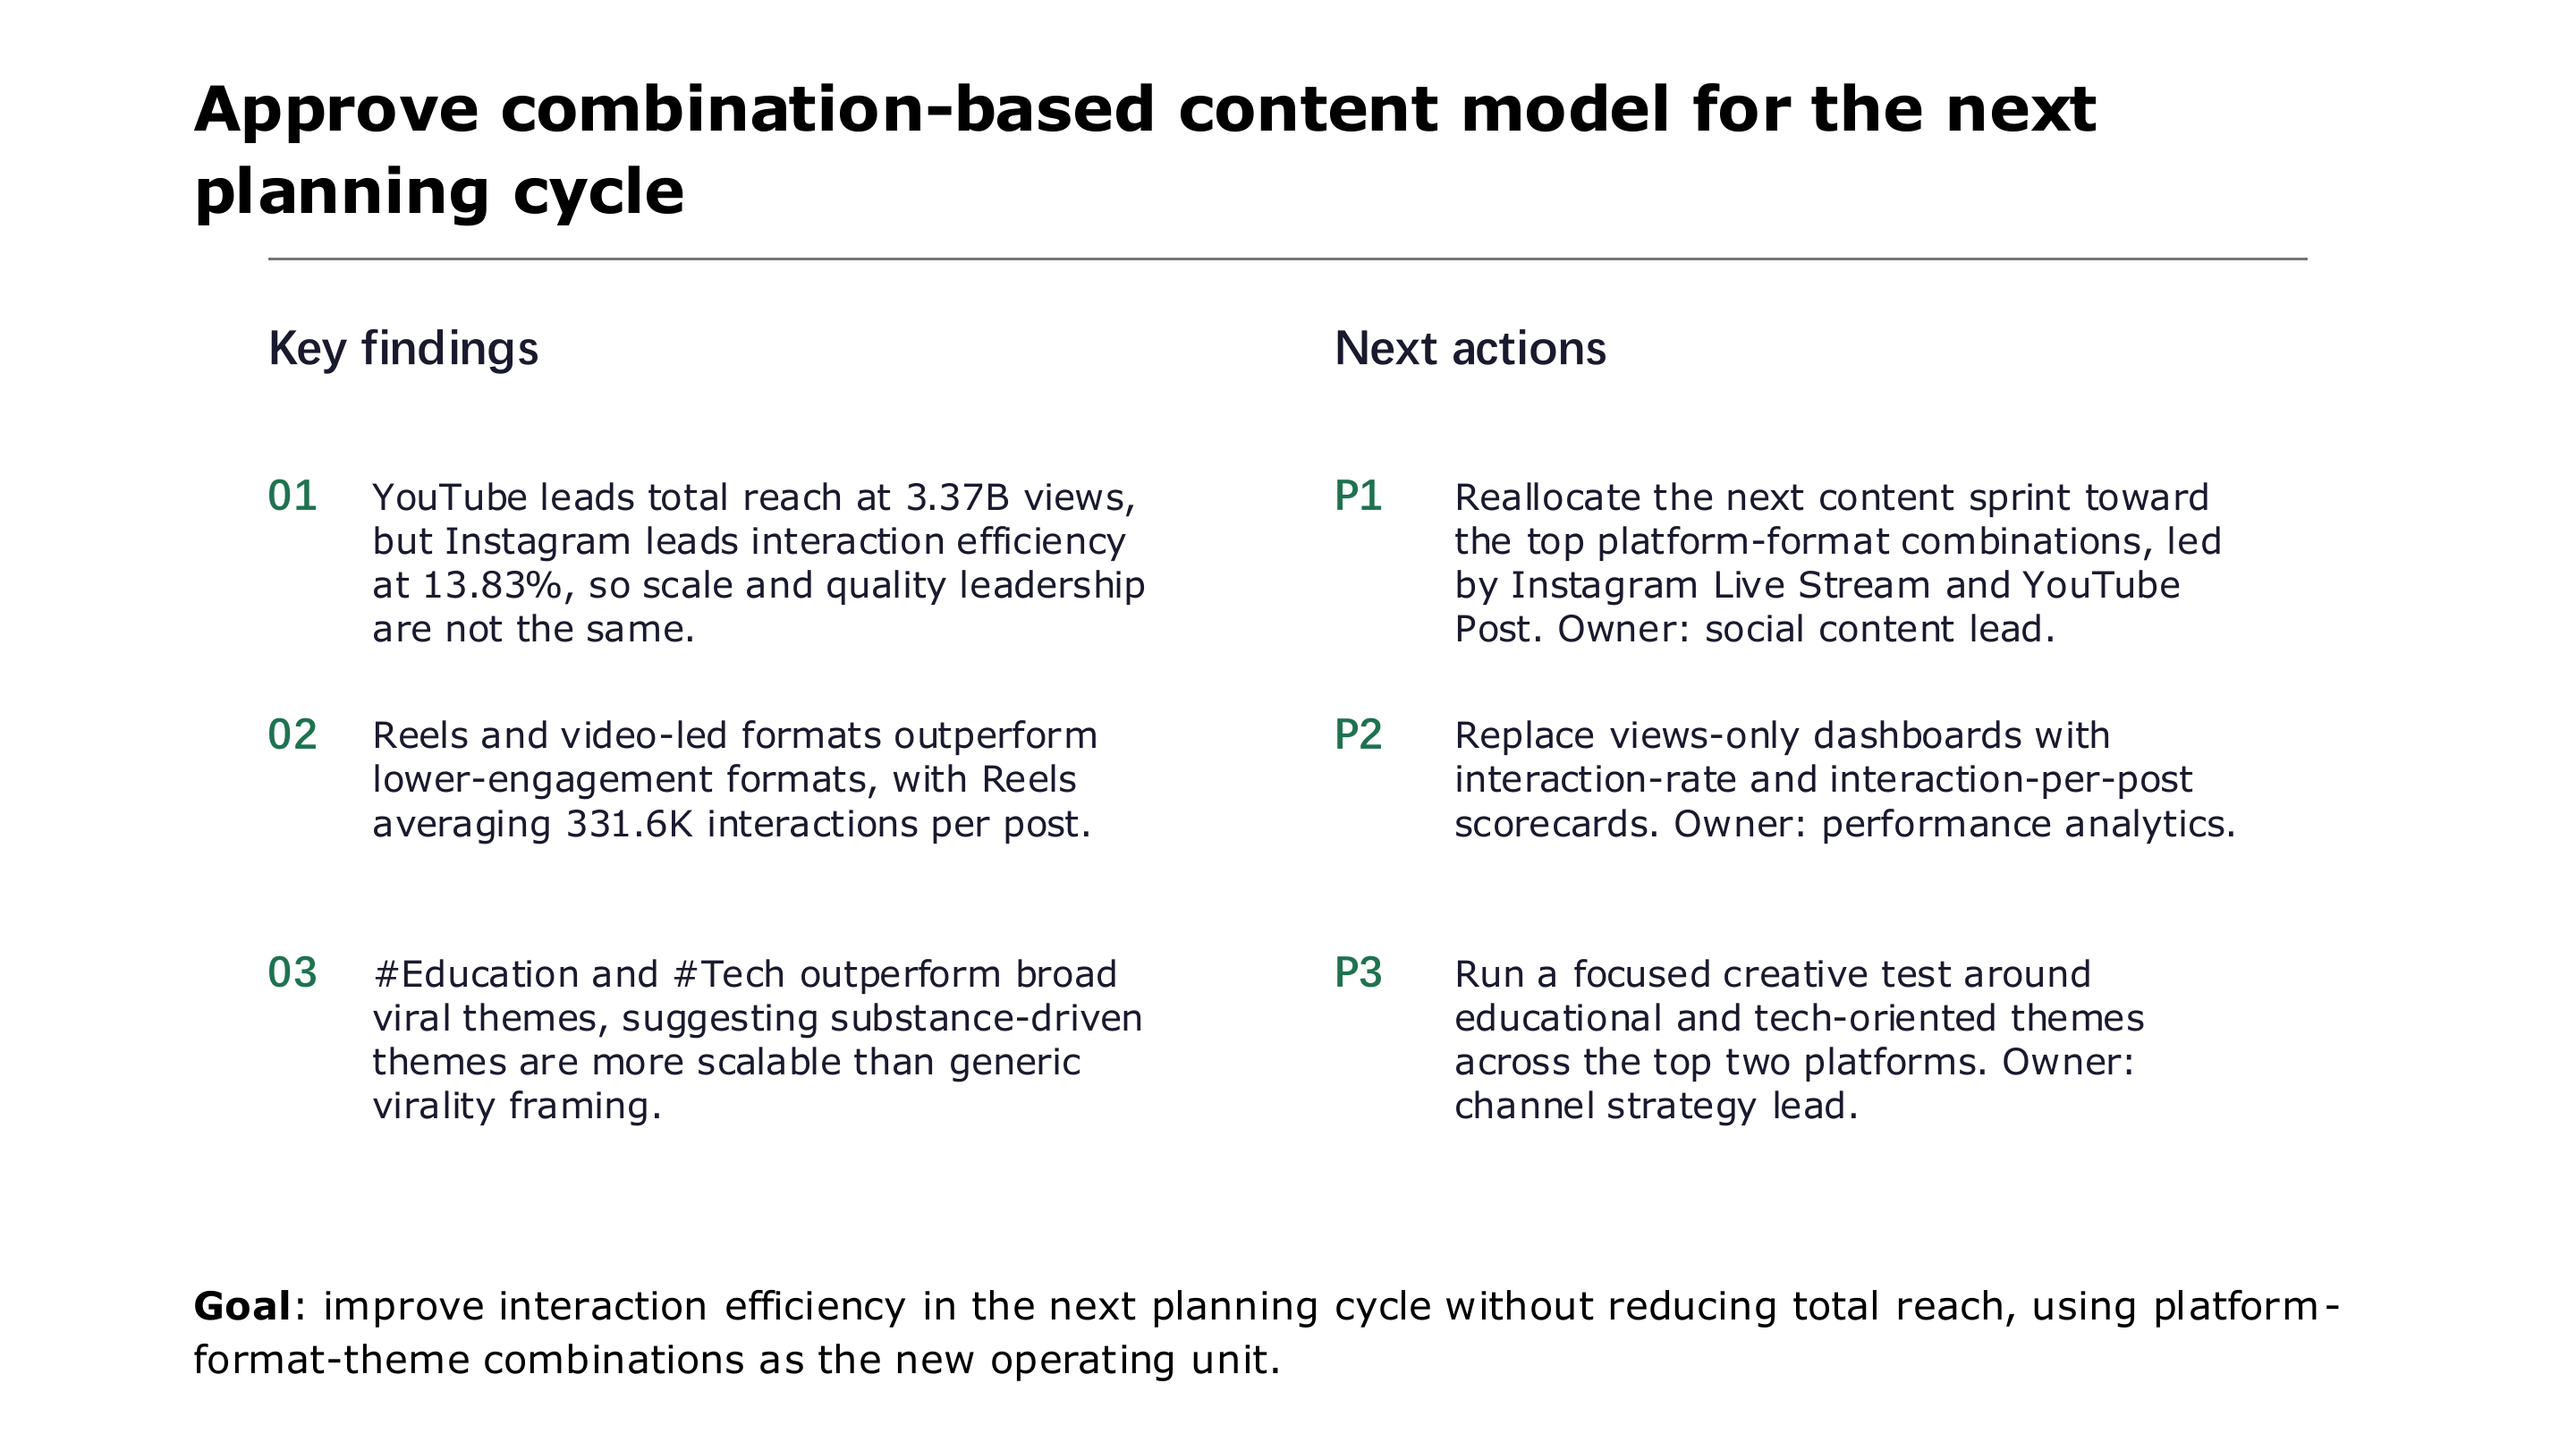
Viral Social Media Performance Review
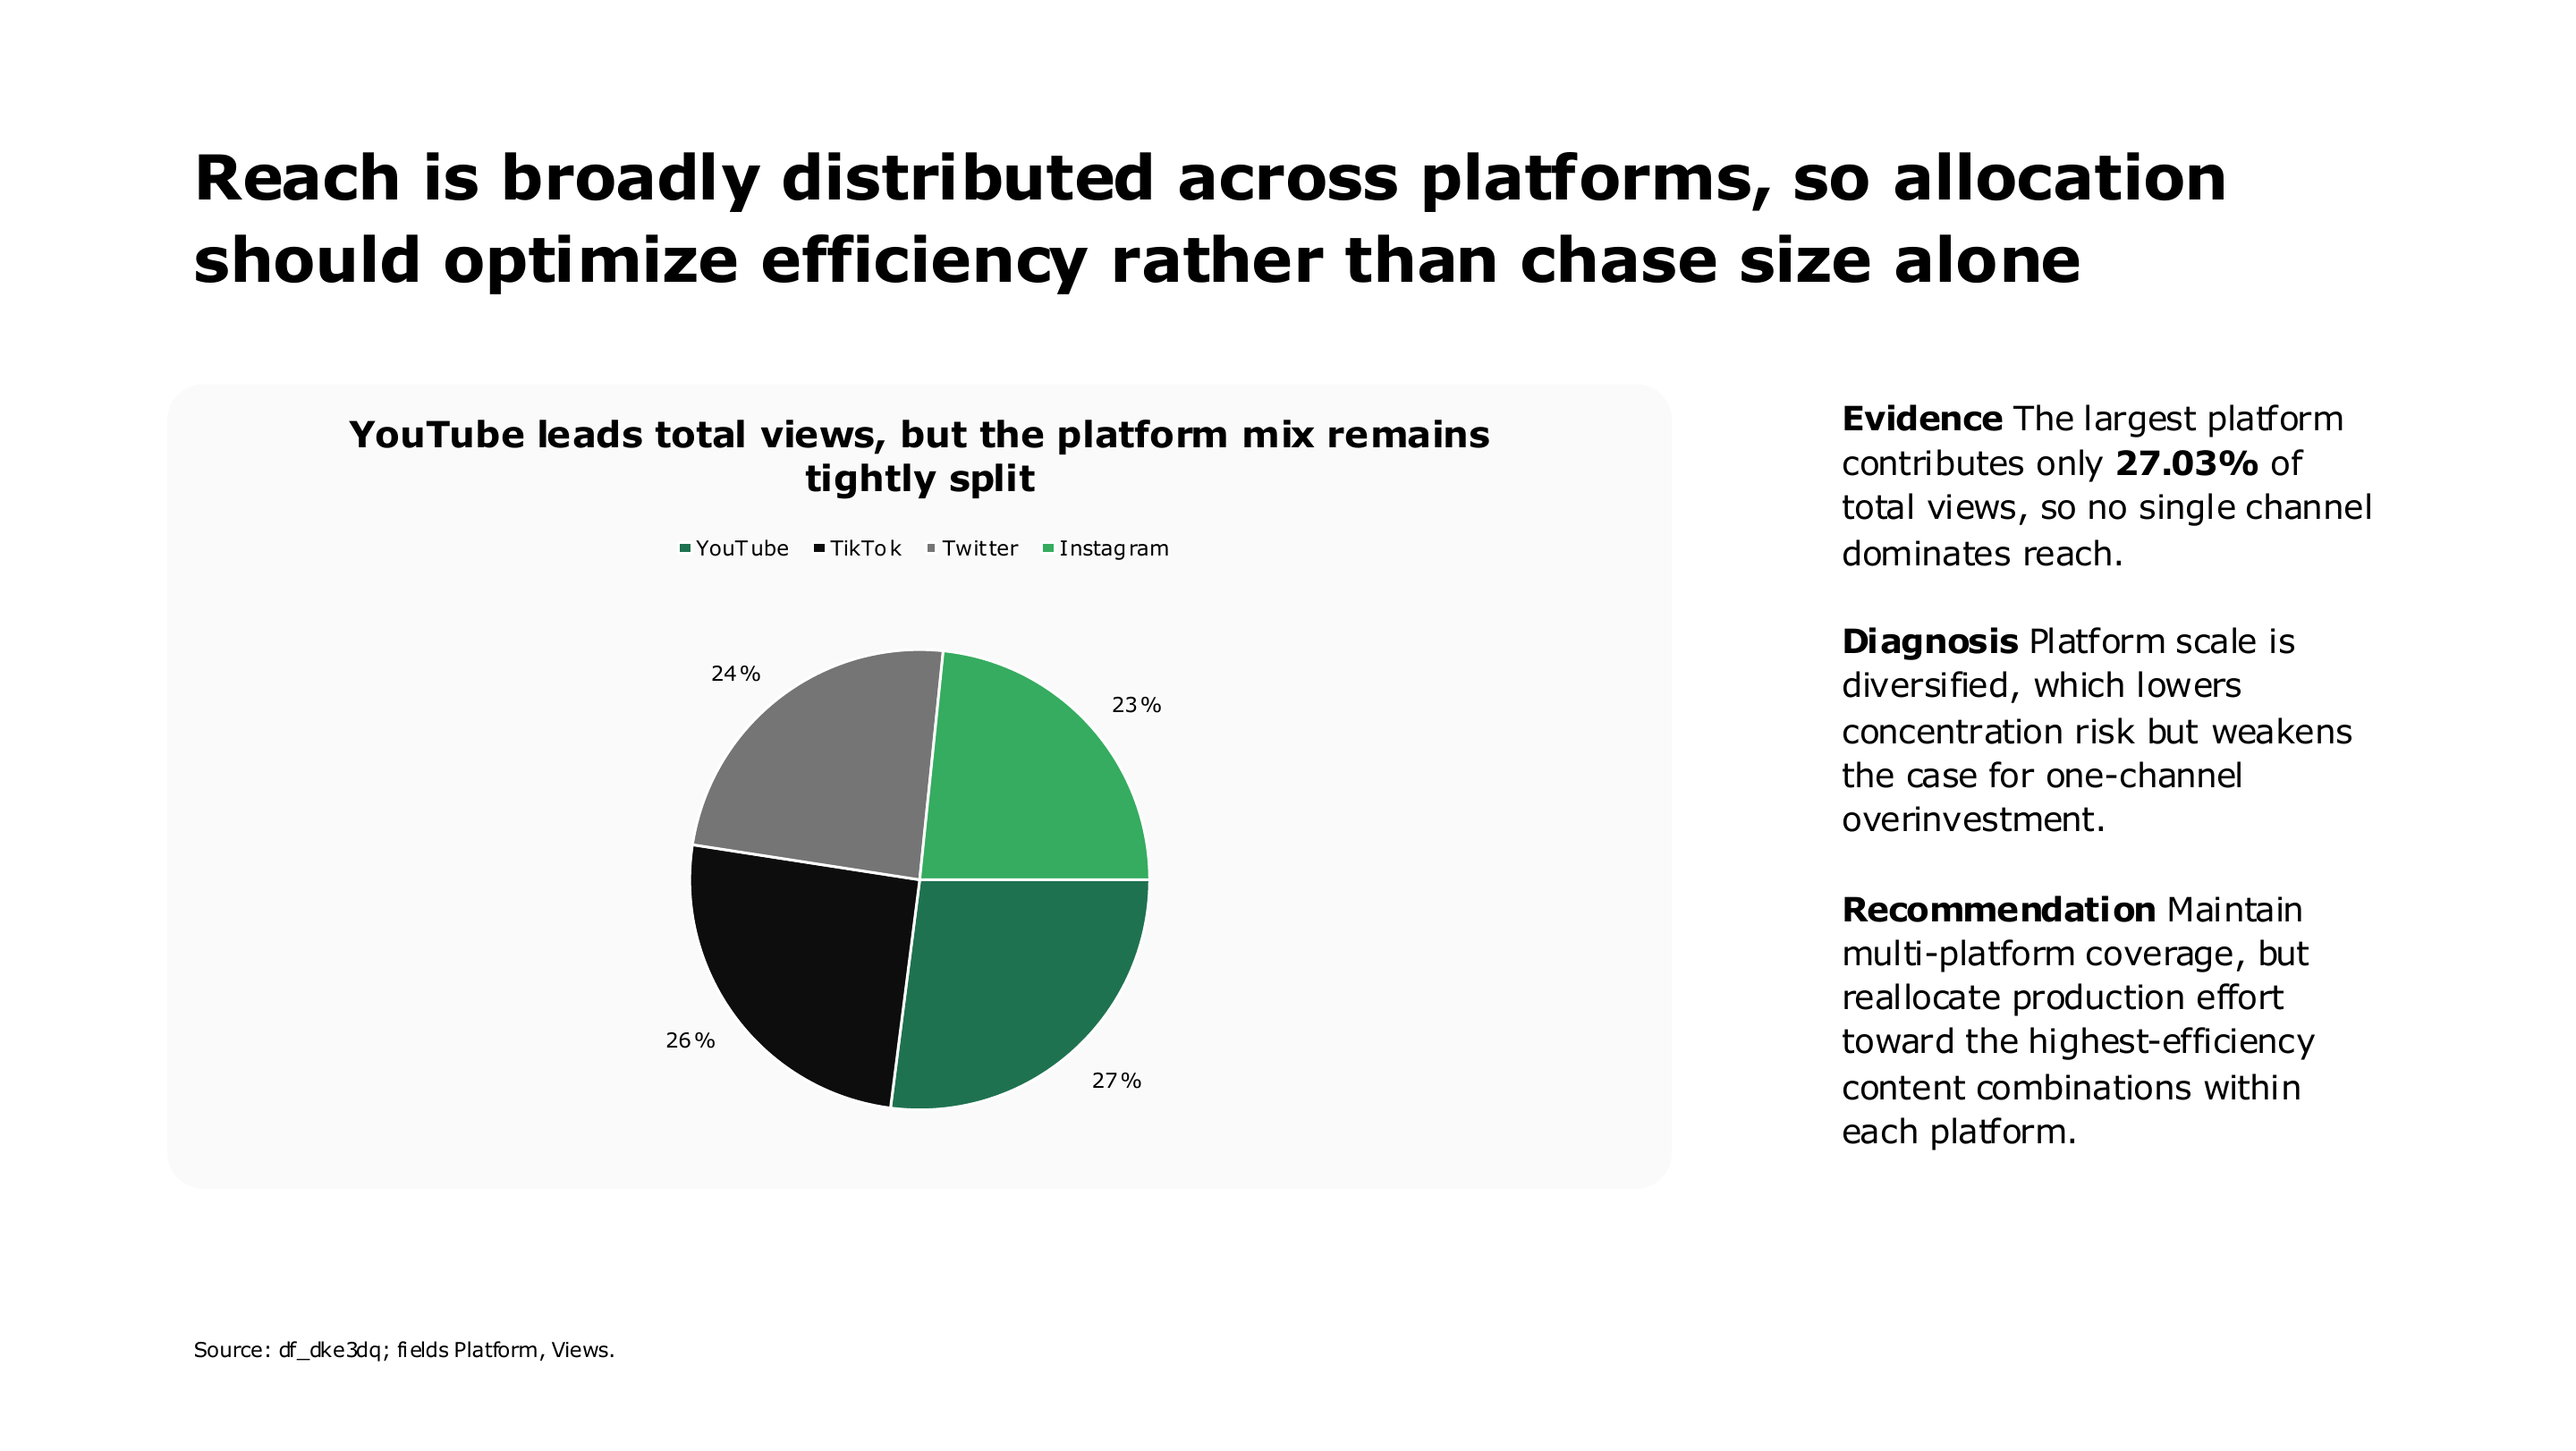
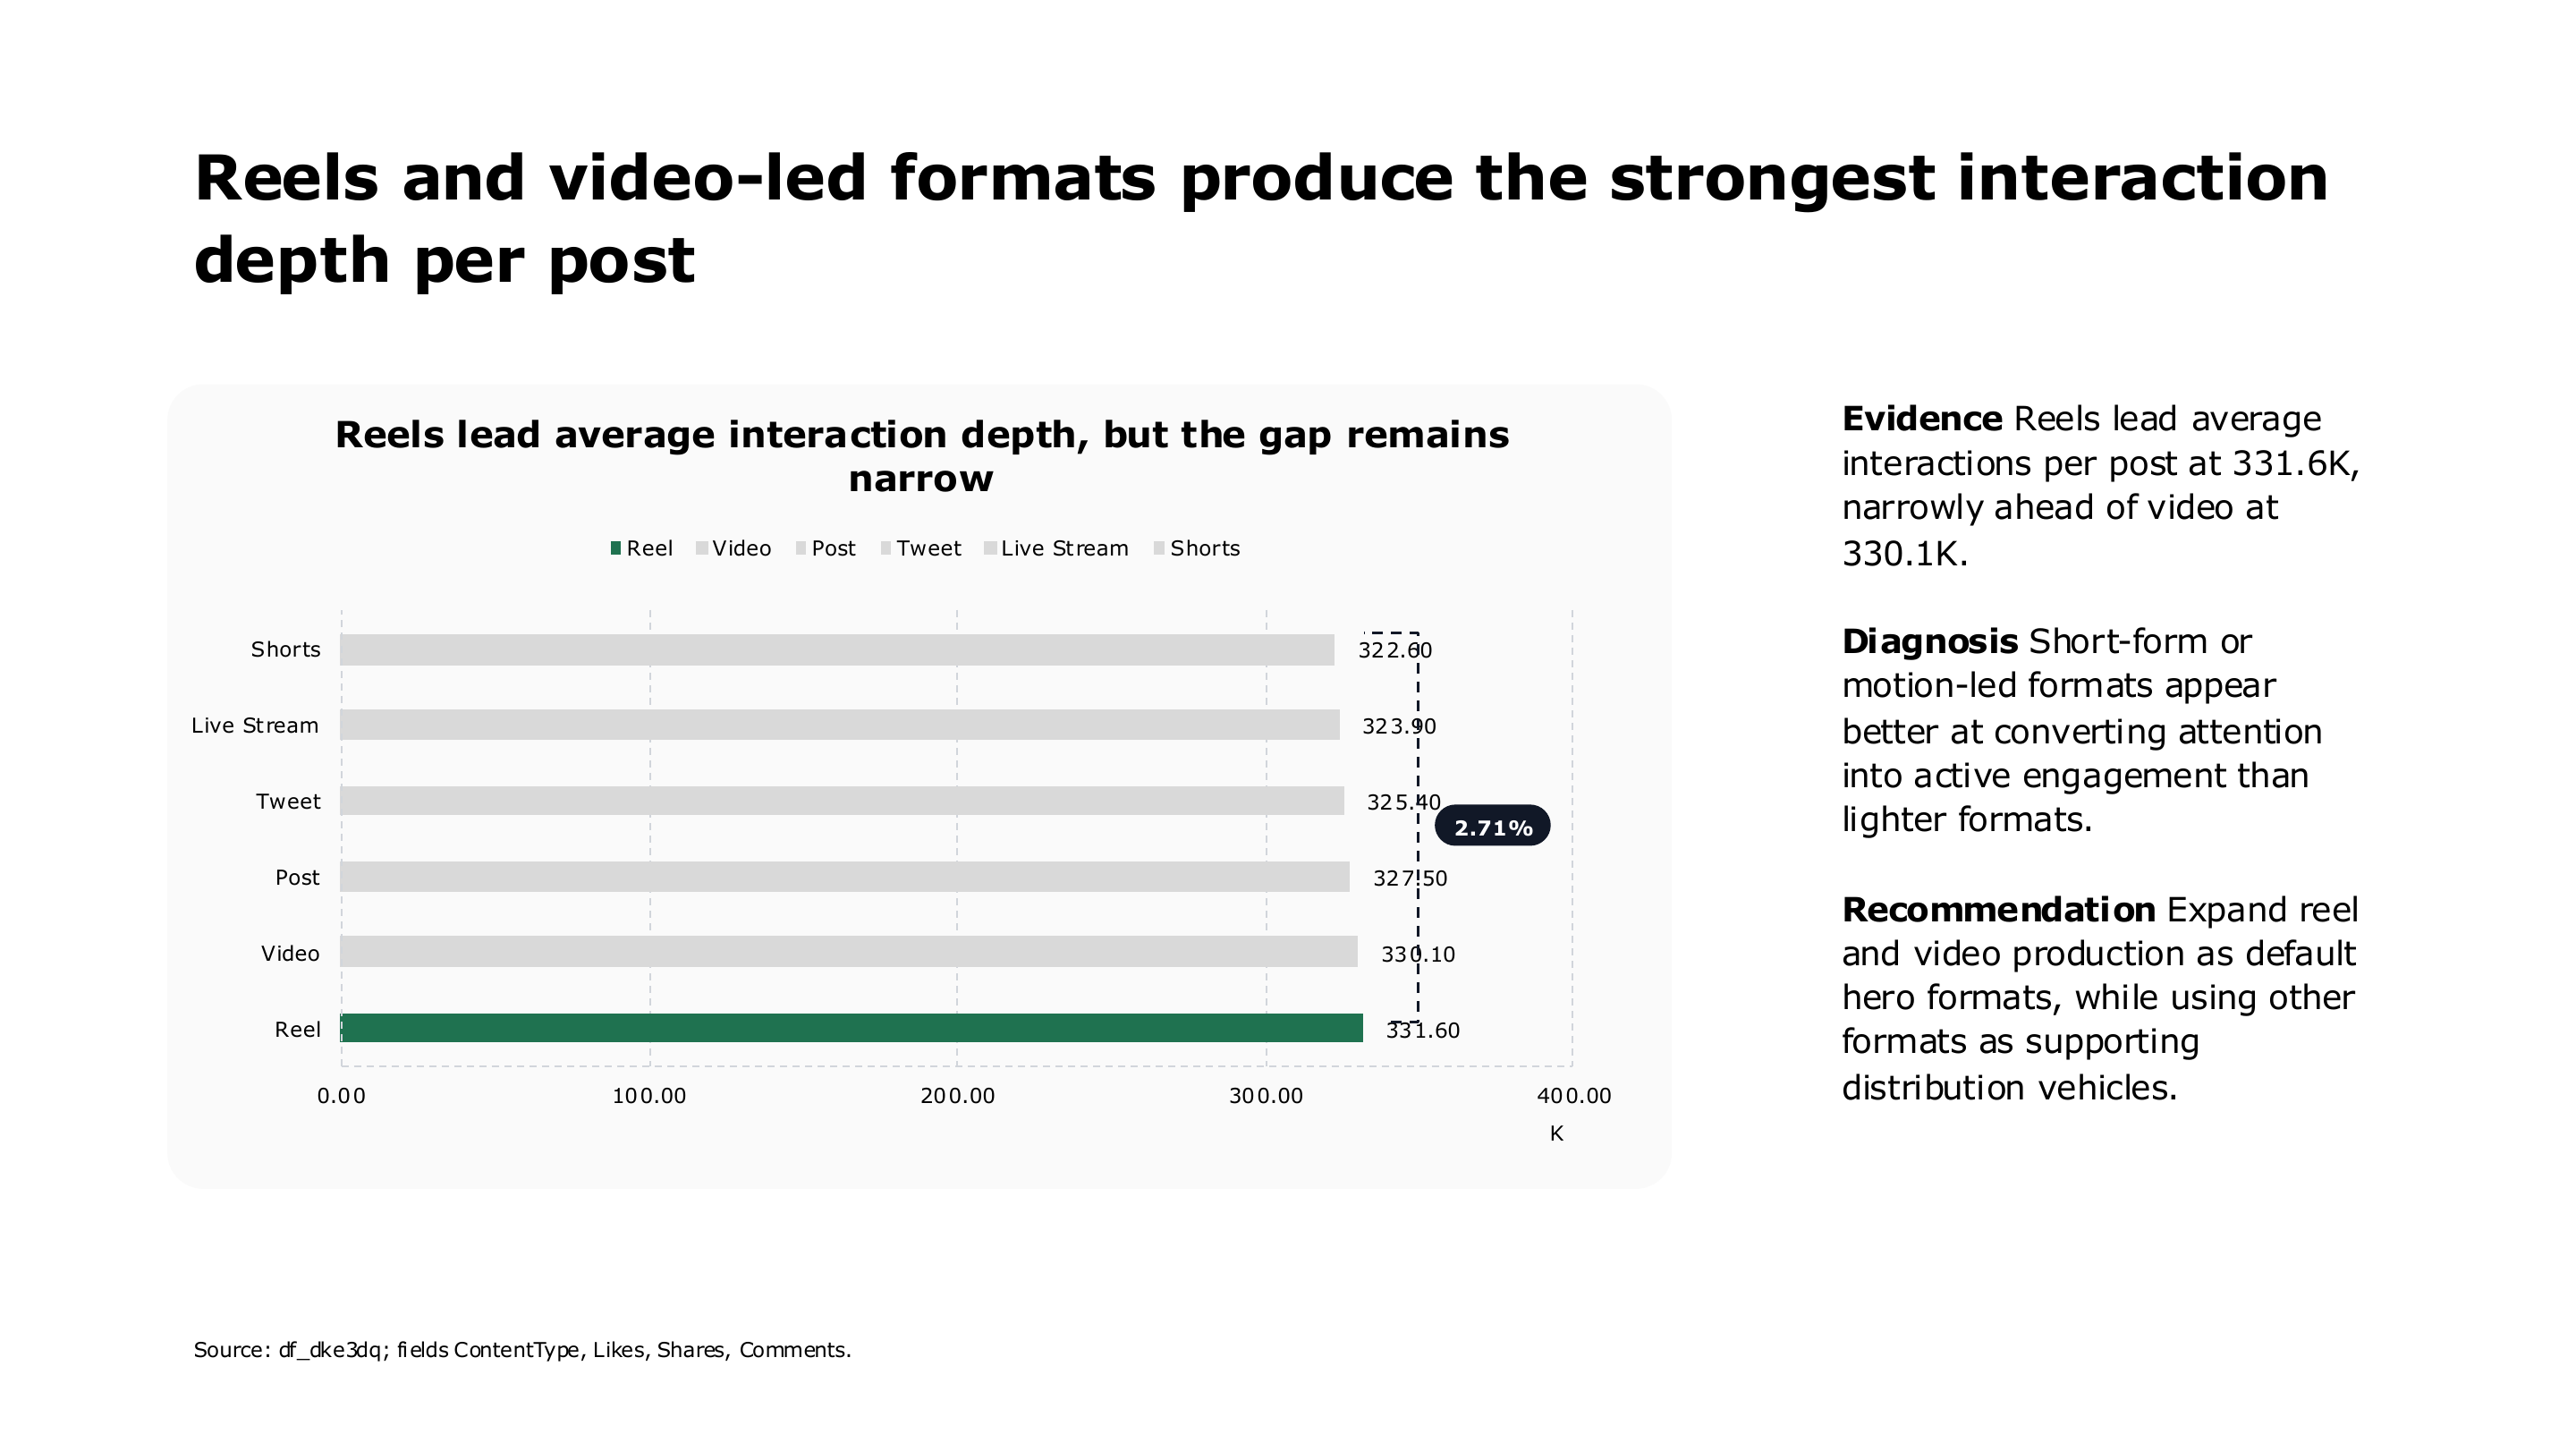
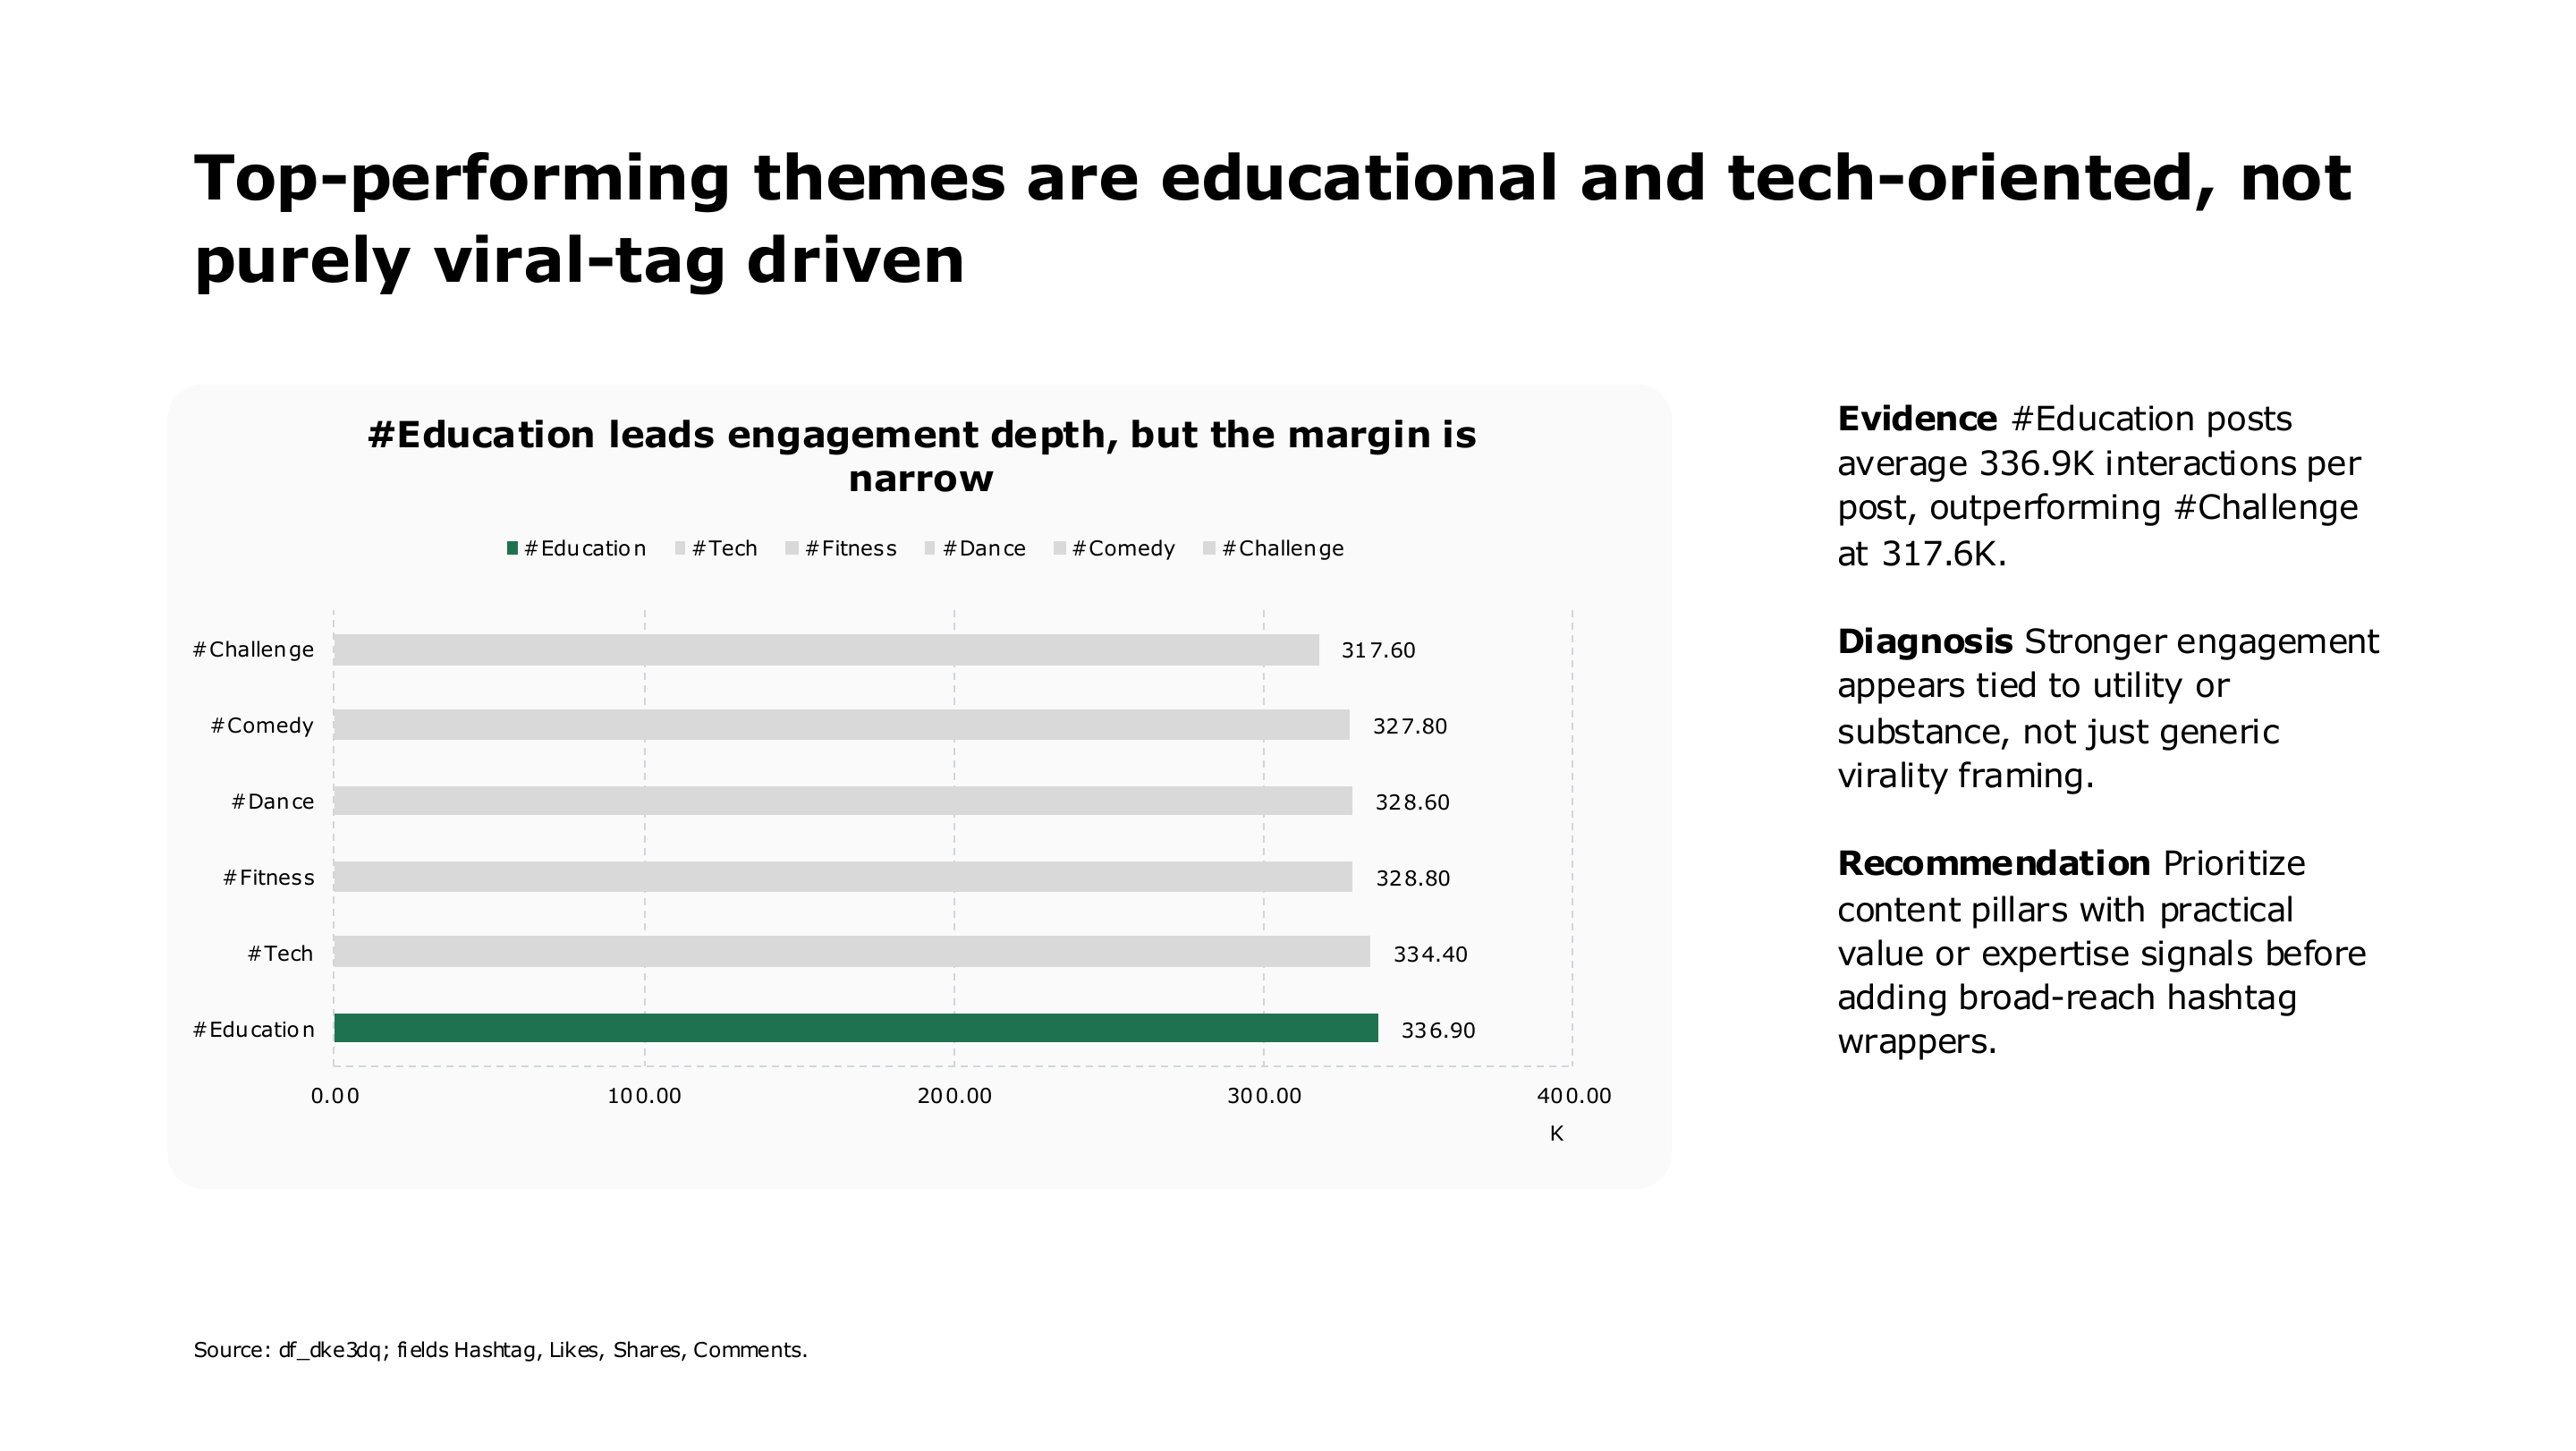
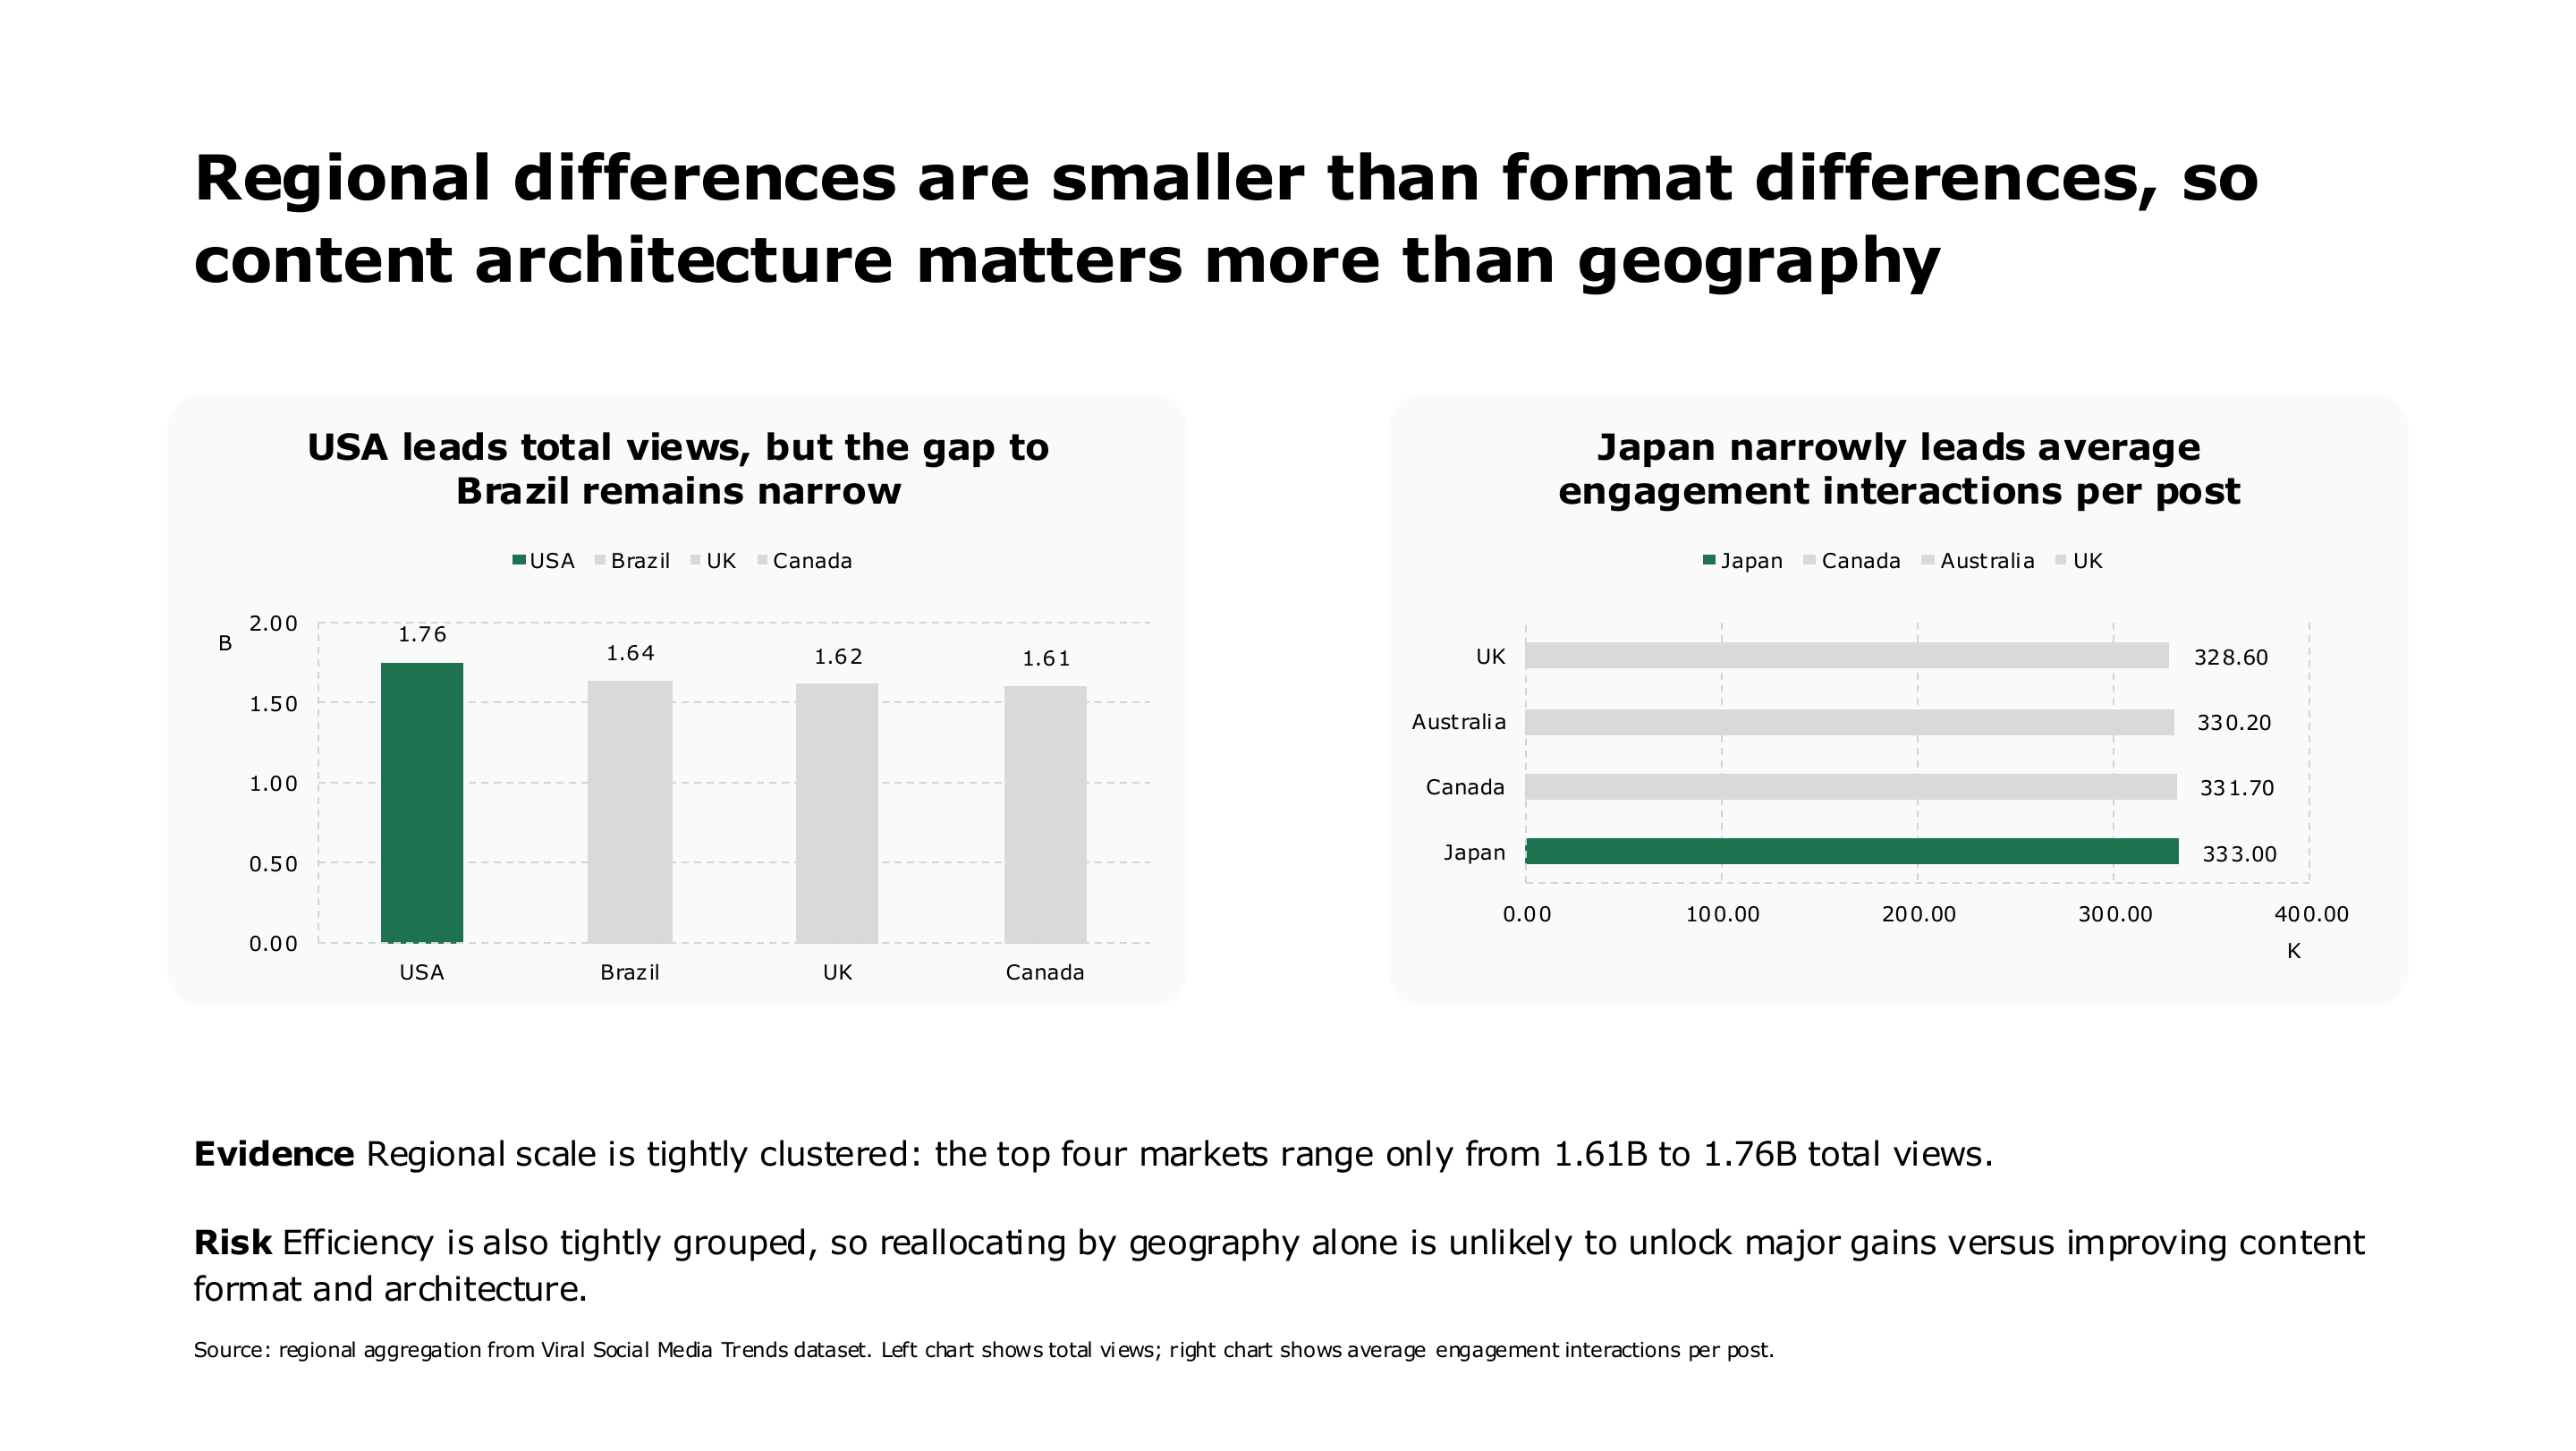
Swipe through all 16 pages of this AI-generated social media performance data report.


From spreadsheet to presentation deck
AI Data Presentations
Turn Excel or CSV data into presentation decks with charts, executive summaries, insights, and recommendations.
AI Reporting Pilot Program
Give us one recurring report. Get a reusable workflow back.
Start with one report your team already uses. Source data is optional and can be added in the next step.
You provide
- 1 existing PPT, PPTX, or PDF report
- Optional Excel or CSV source data
We provide — free
- 1 customized, reusable reporting template
- Placed directly in an account created for your work email
- Free credits to generate and test report drafts
- A report-only submission is enough to get started
- One free template per organization
Built for agencies, consultants, and reporting teams. One person can submit on behalf of the team.
Free to join · No commitment
Explore before you report
Start with the question behind the data.
Run a complete AI analysis or ask one focused question. Keep the evidence, continue the investigation, and turn the findings into a finished report.
Explore the full dataset
Analyze Data with AI
Upload Excel or CSV data to uncover trends, performance drivers, anomalies, and business opportunities before you build the final report.
Analyze my dataStart with a direct question
Chat With Your Data
Ask questions in plain English and get answers grounded in your spreadsheet, with supporting metrics, tables, charts, and follow-up analysis.
Ask my data a questionMore ways to analyze
Start with whatever you have.
Turn an image, a question, or a spreadsheet into a clear answer without rebuilding the workflow from scratch.