Software de relatórios automatizadosCriado para entregas profissionais.

Criado para

Transforme Excel, CSV, texto, imagens e pesquisas na web em relatórios para clientes, dashboards e arquivos editáveis de PowerPoint, Word ou Excel.


Mais de 300.000 usuários em todo o mundo

MCP & SKILLS

Connect MCP. Deliver reports in your Agent.

ExcelDashboard AI provides an MCP server and a report Skill. Your Agent analyzes and verifies data, then creates visual reports, tracks progress, and gets live previews. First connection requires user sign-in and workspace selection.

Connection information for Agents

Production MCP endpoint

https://api.exceldashboard.ai/mcp

Streamable HTTP · OAuth · create_report / get_report

Agents: read https://www.exceldashboard.ai/mcp.md for the complete English Skill, outline format, and client setup. Reading documentation does not configure MCP or complete OAuth.

Setup instruction for your Agent

Read https://www.exceldashboard.ai/mcp.md, including the full report Skill and outline reference. Use this client's supported workflow to configure ExcelDashboard AI MCP at https://api.exceldashboard.ai/mcp with Streamable HTTP. Guide me through browser OAuth and workspace selection. Install the report Skill from https://smithery.ai/skills/exceldashboard-ai/exceldashboard-report if supported; otherwise follow its complete instructions in this conversation. Verify the current session discovers create_report and get_report. Do not create a report. If this client cannot configure a custom MCP connection, explain that limitation and give its supported setup steps; do not claim a connection from reading the website.

Um espaço de trabalho com IA

Três maneiras de transformar dados em respostas.

Envie seus dados ou comece com uma pergunta. A IA cria o material final.

Viral Social Media Performance Review

Swipe through all 16 pages of this AI-generated social media performance data report.
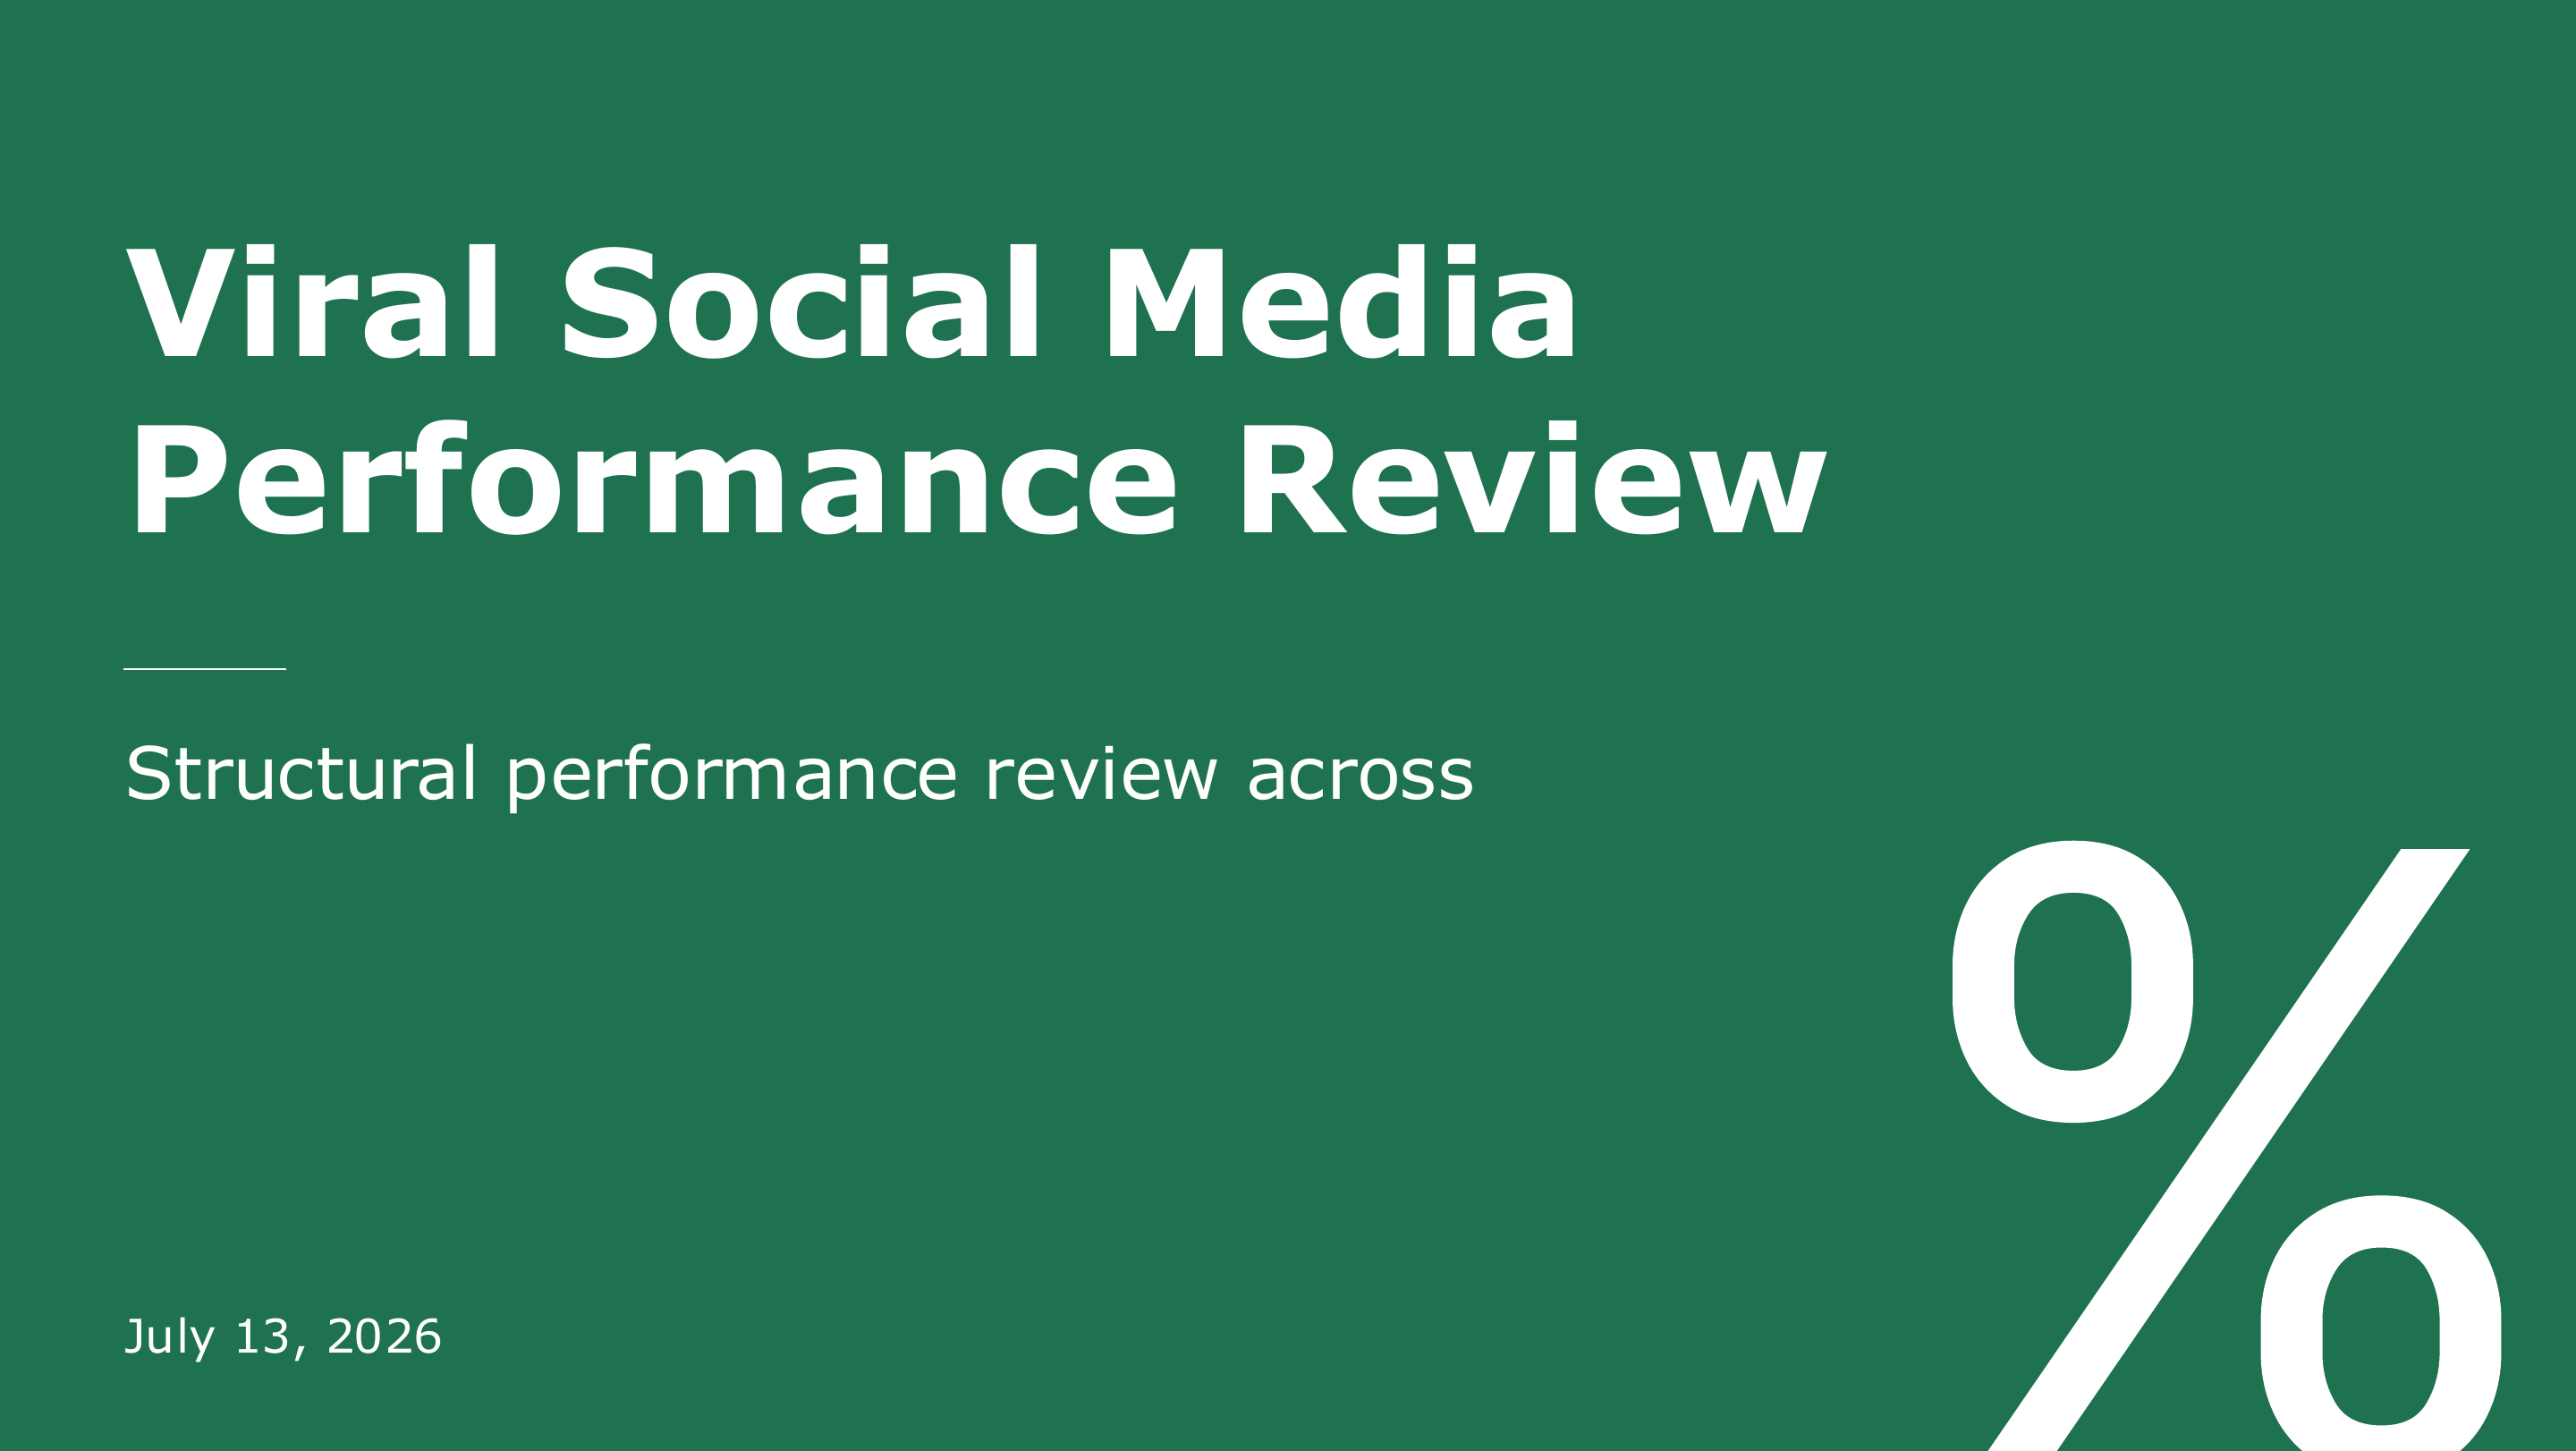
Viral Social Media Performance Review cover — page 1 of 16
Viral Social Media Performance Review cover
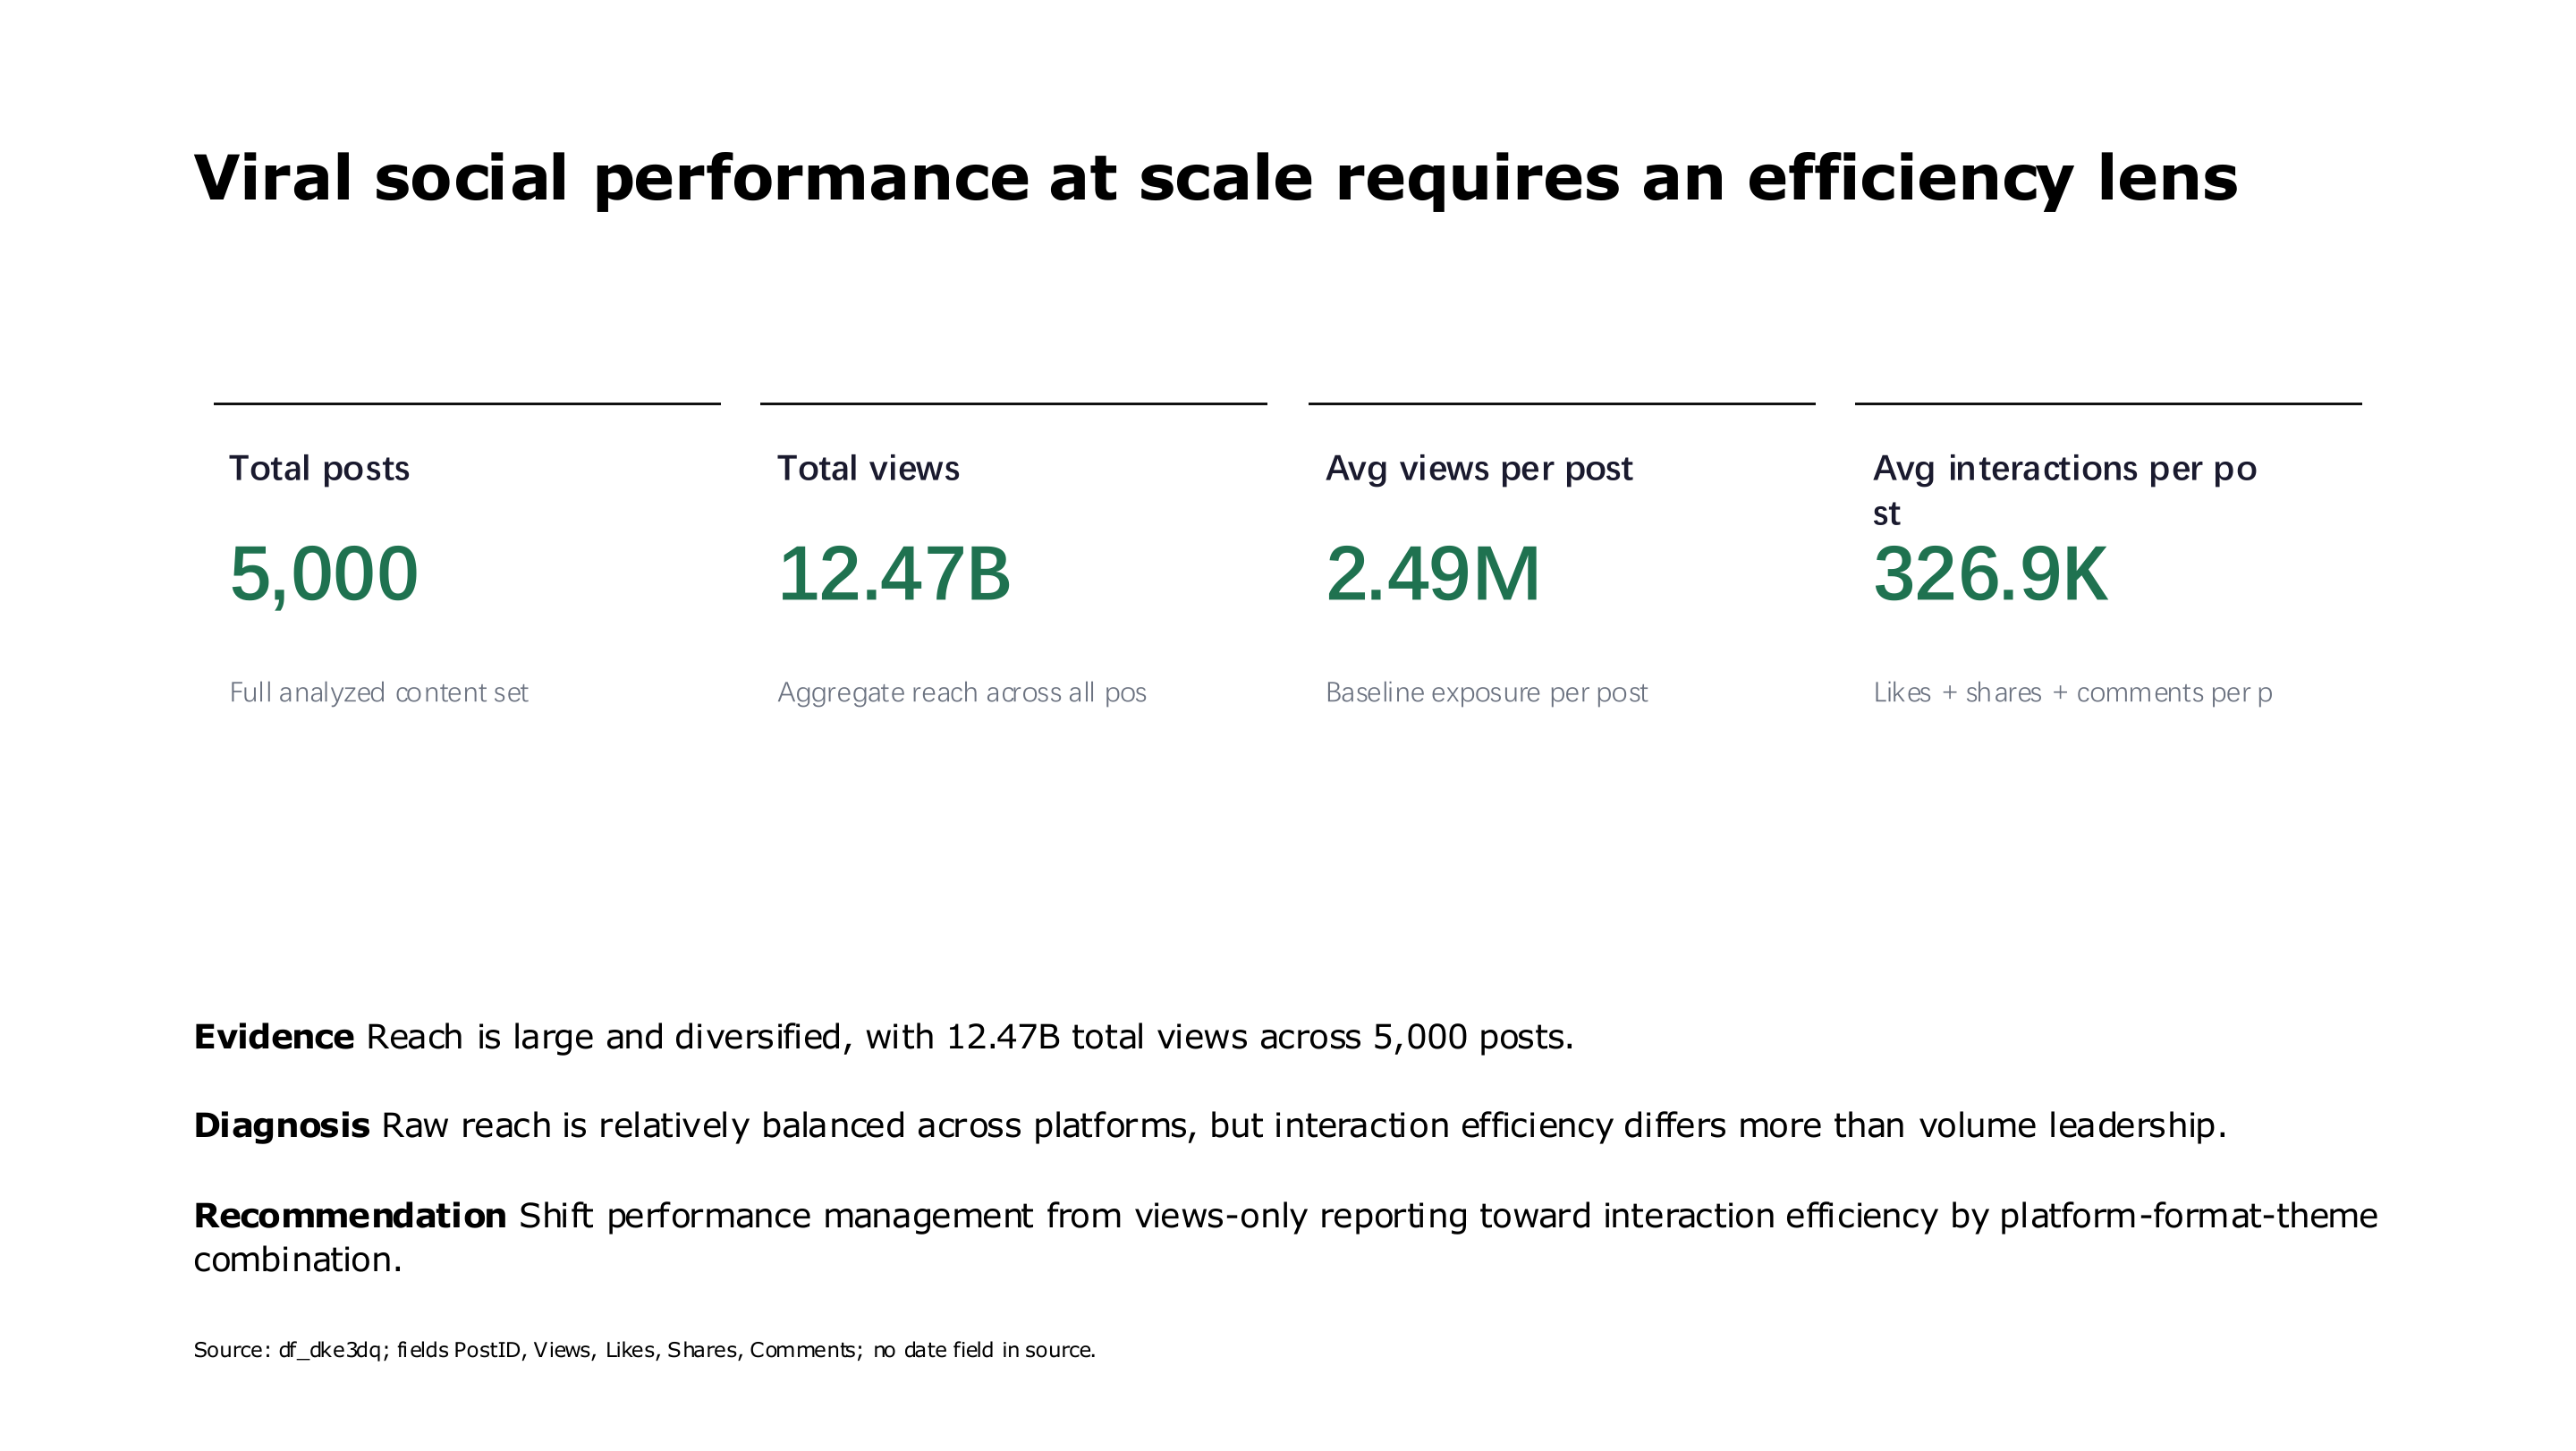
Viral social media performance at scale executive summary — page 2 of 16
Viral social media performance at scale executive summary
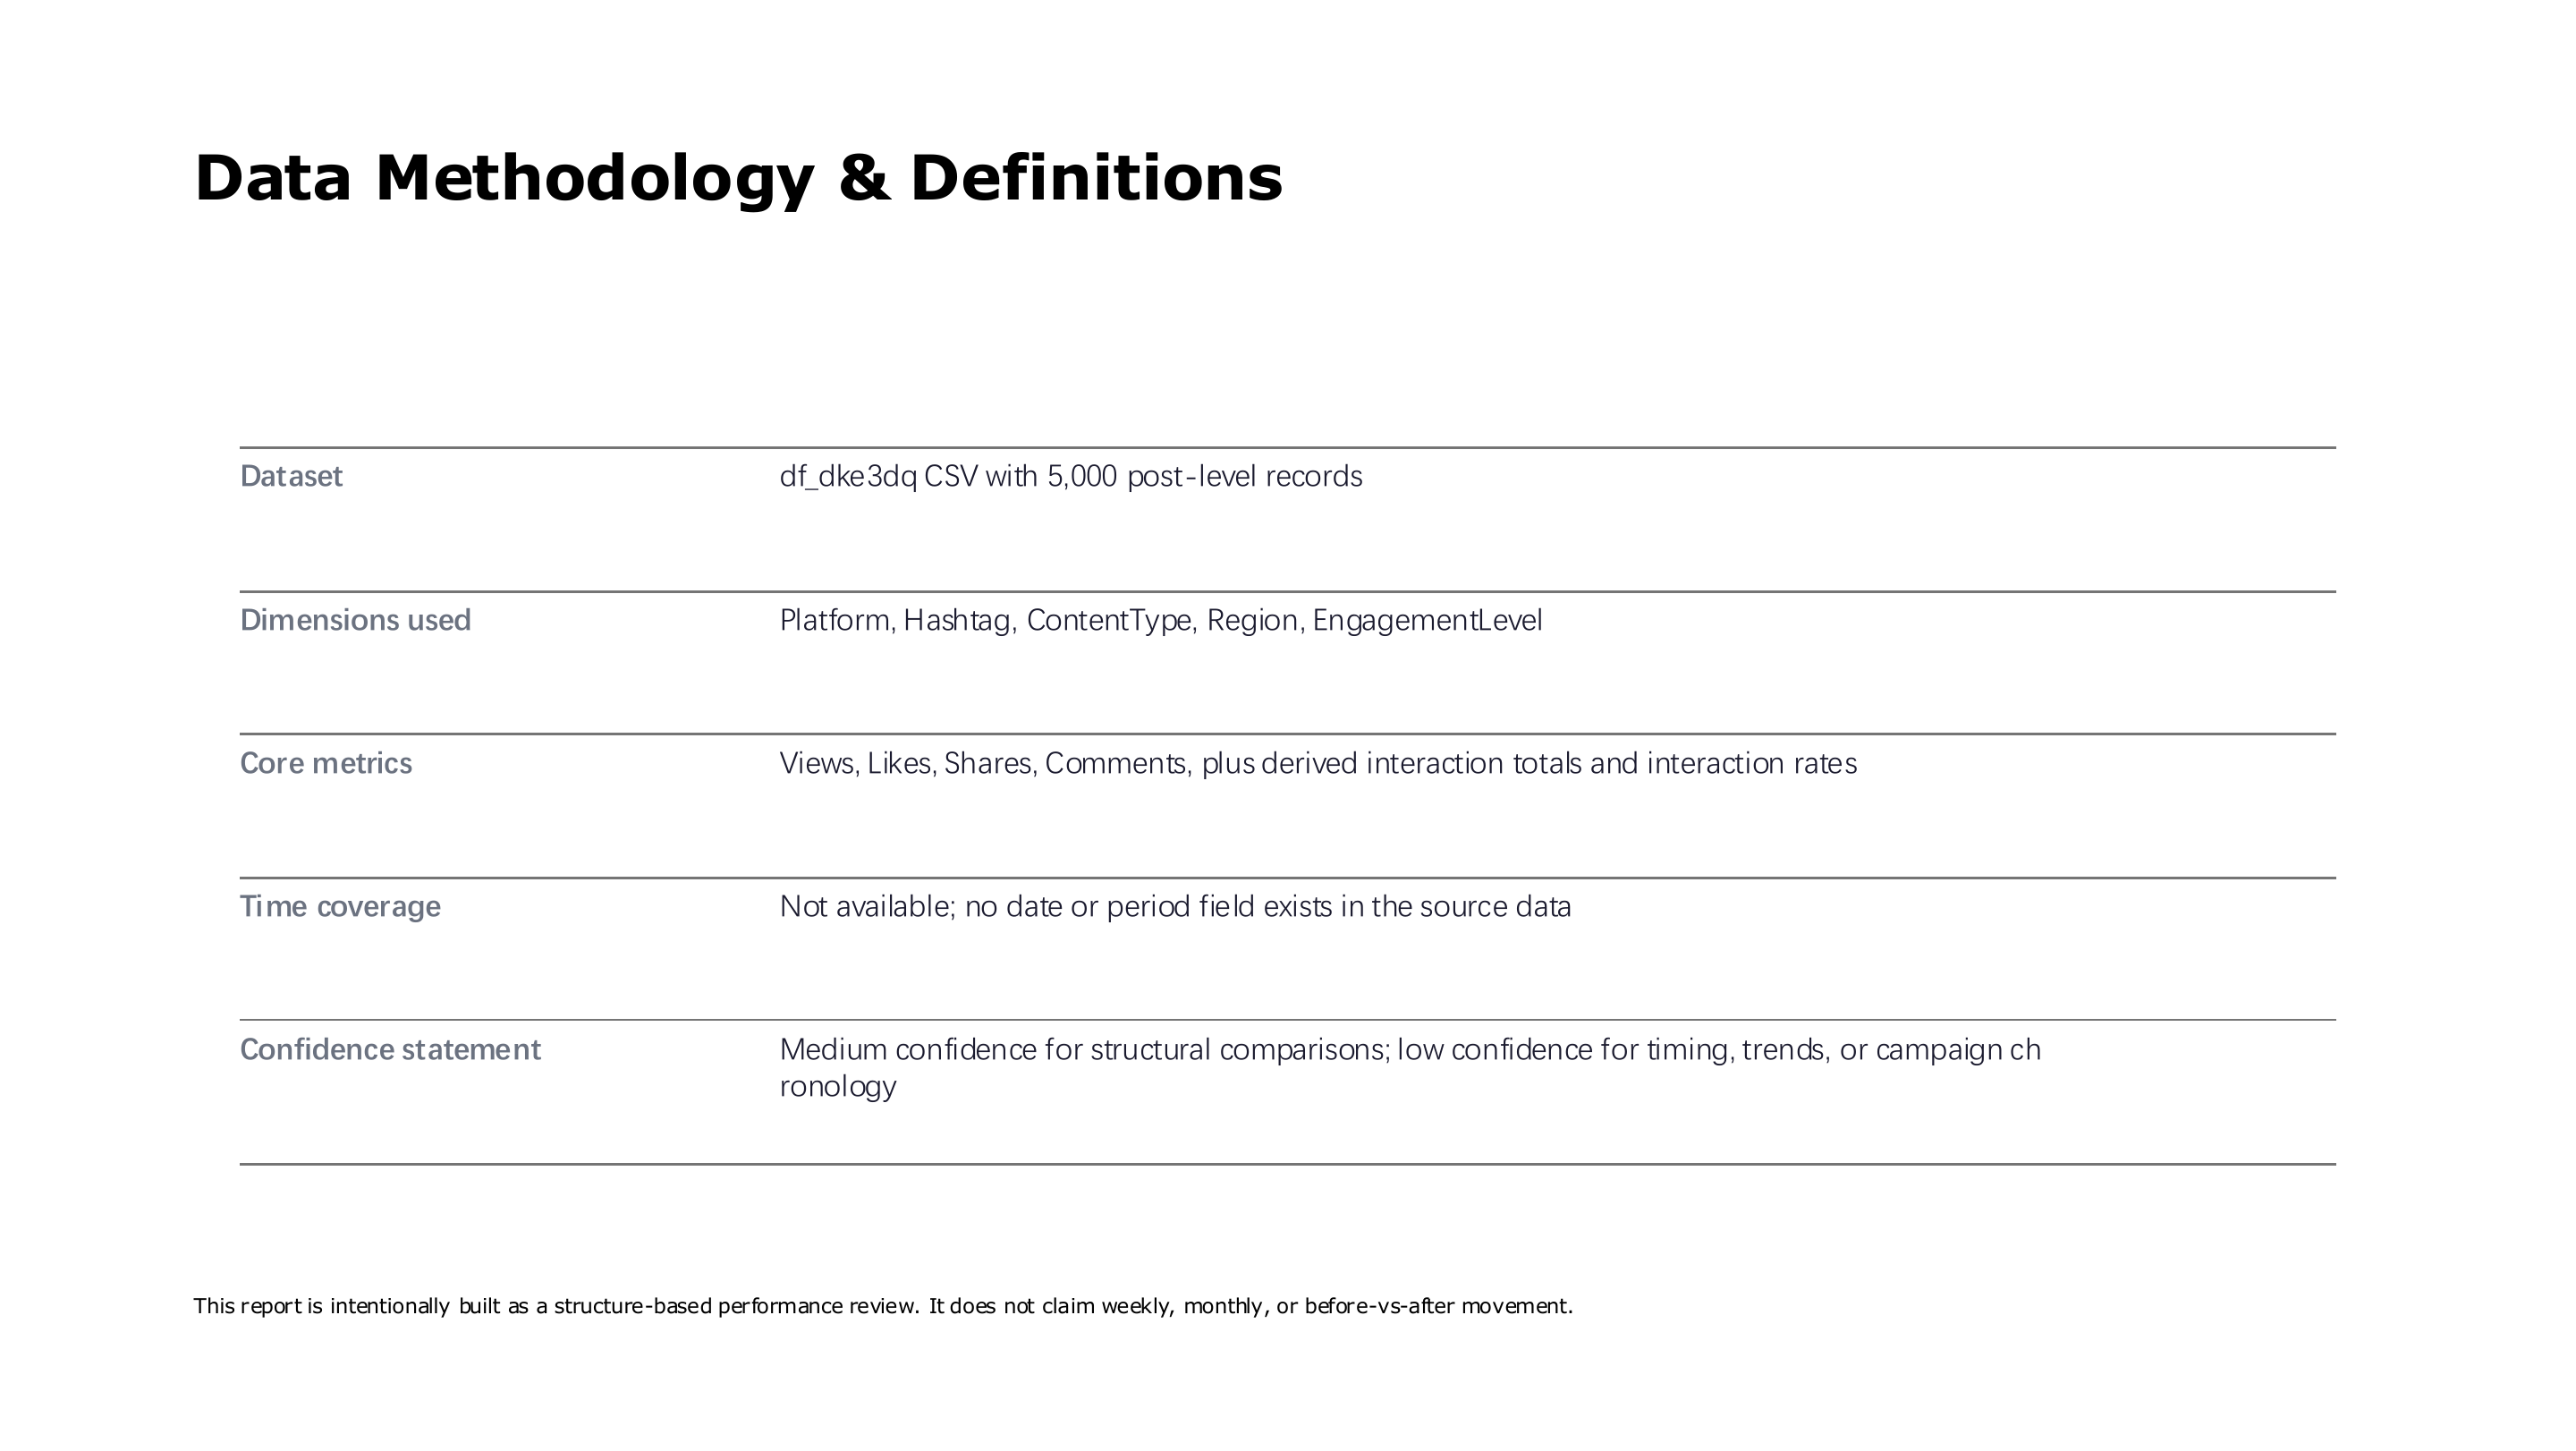
Social media data methodology and metric definitions — page 3 of 16
Social media data methodology and metric definitions
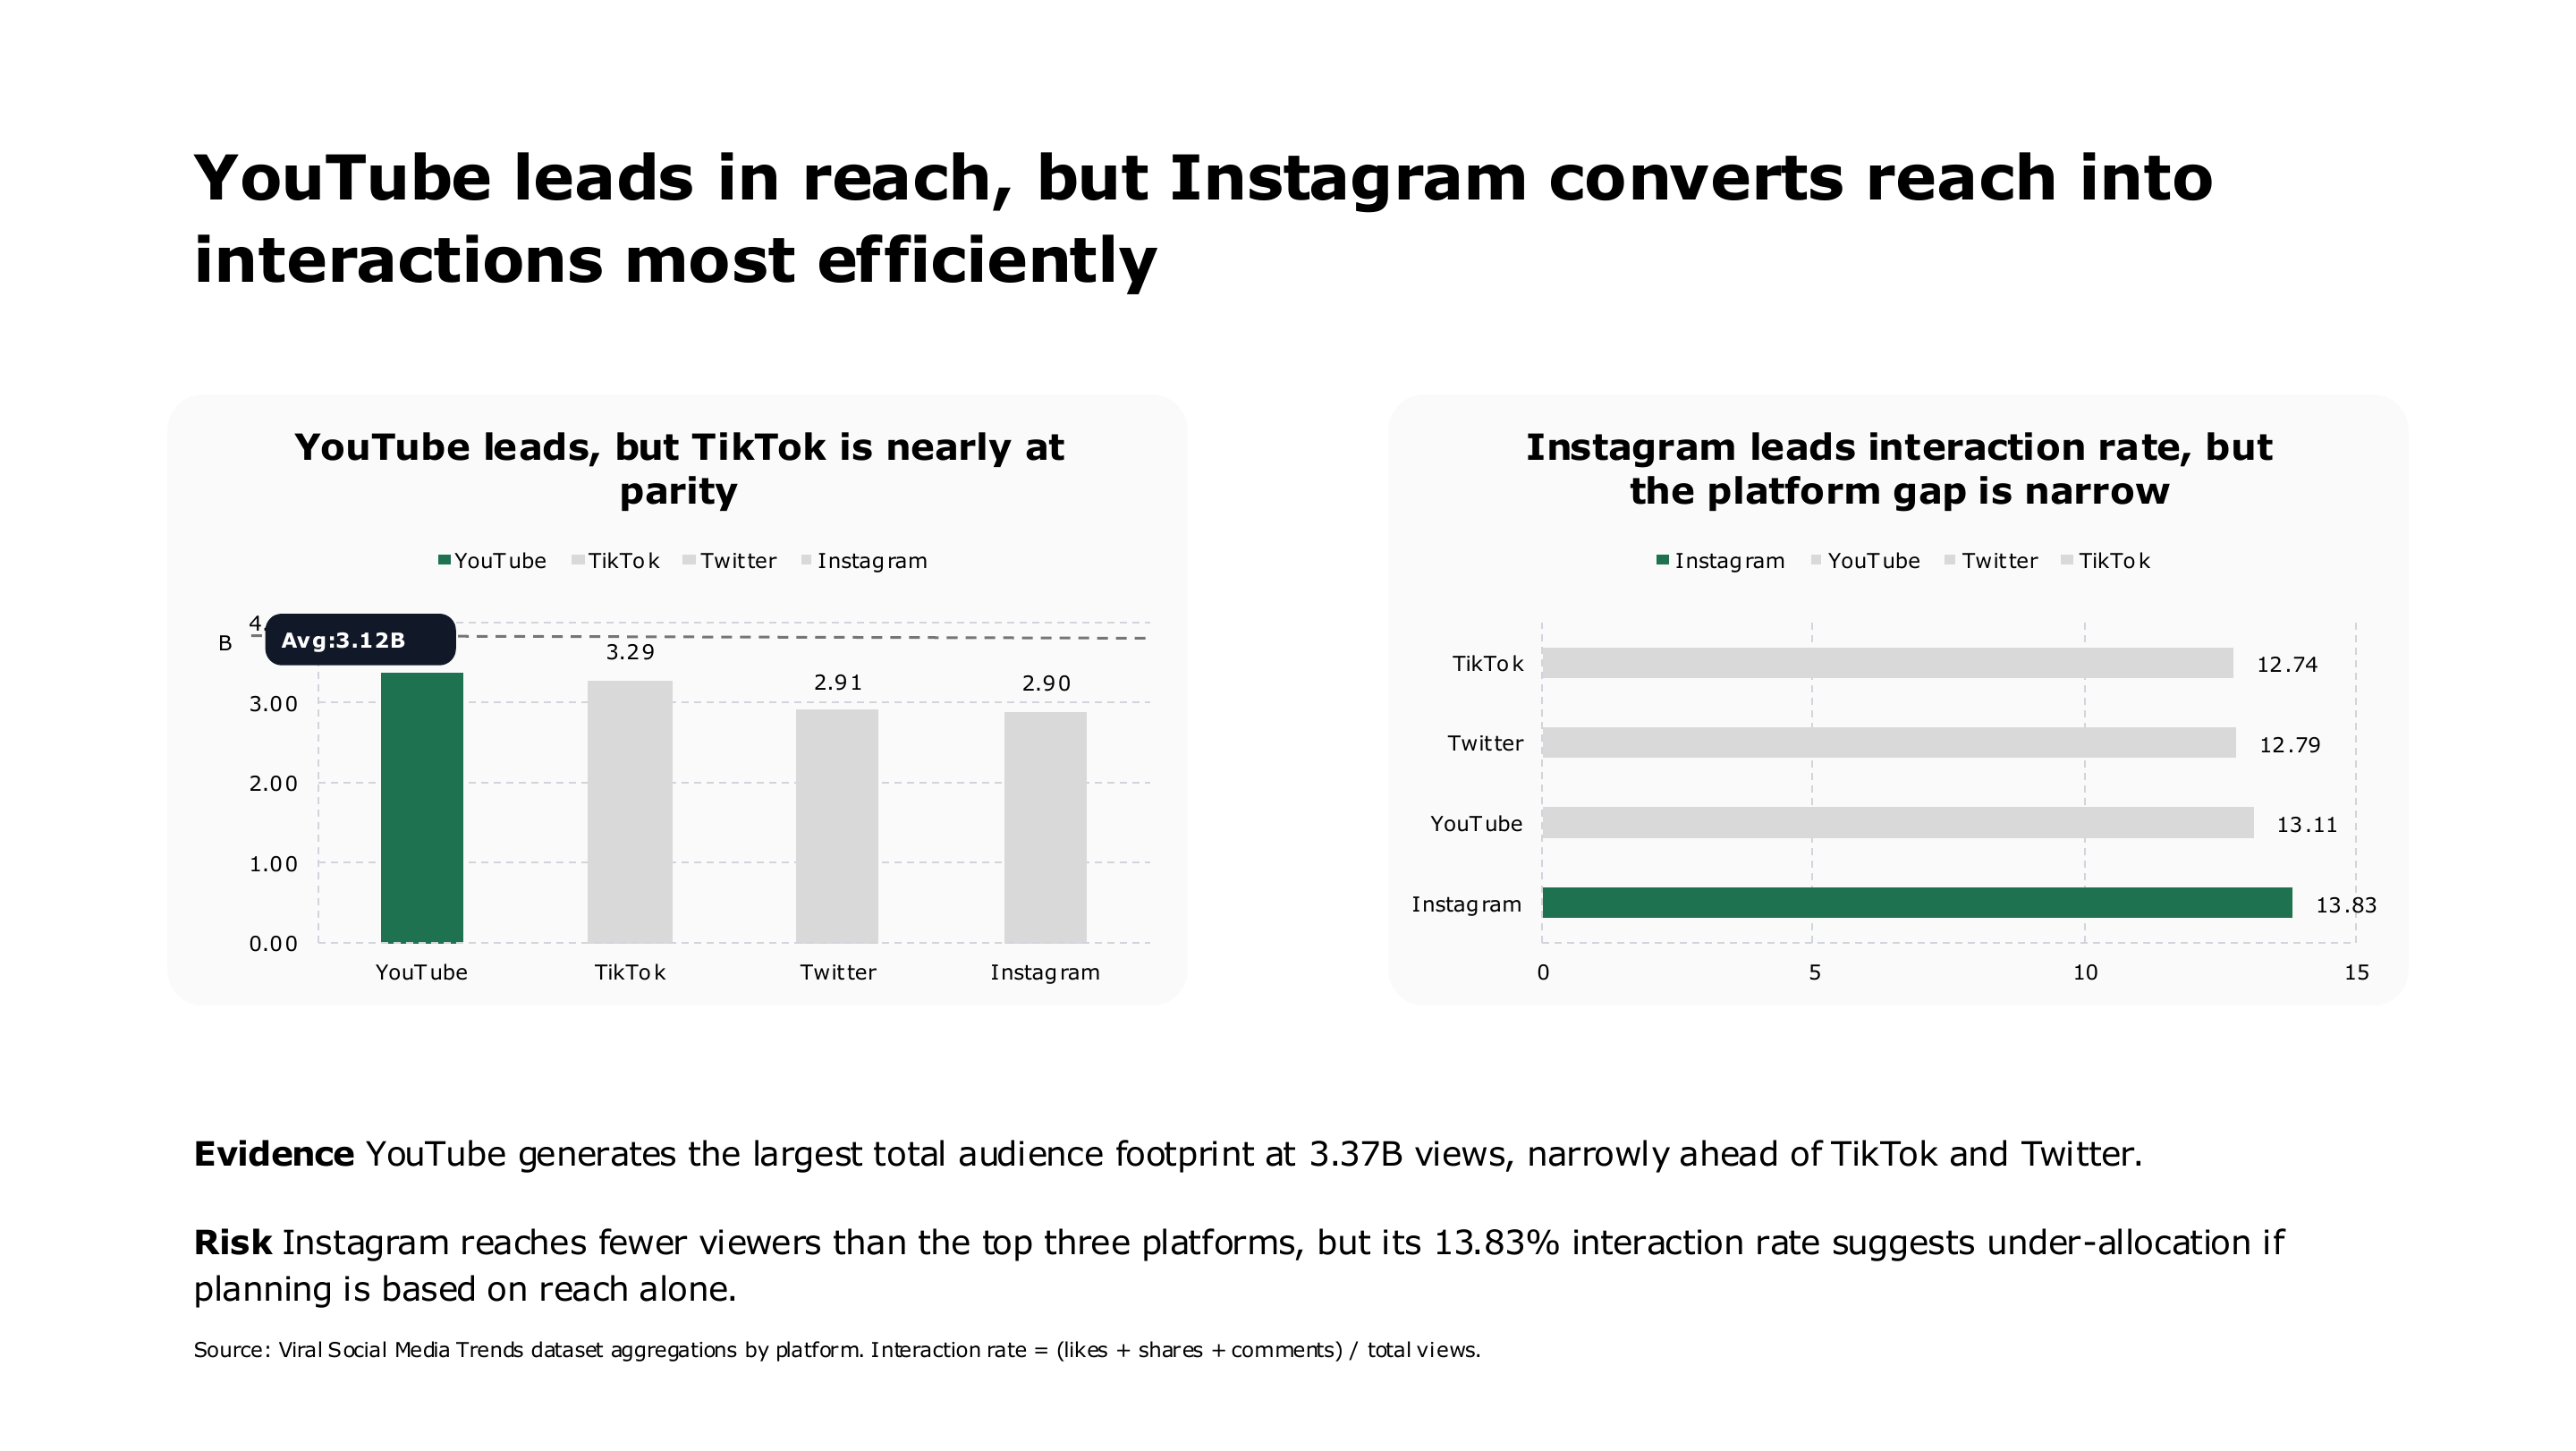
YouTube reach and Instagram interaction efficiency comparison — page 4 of 16
YouTube reach and Instagram interaction efficiency comparison
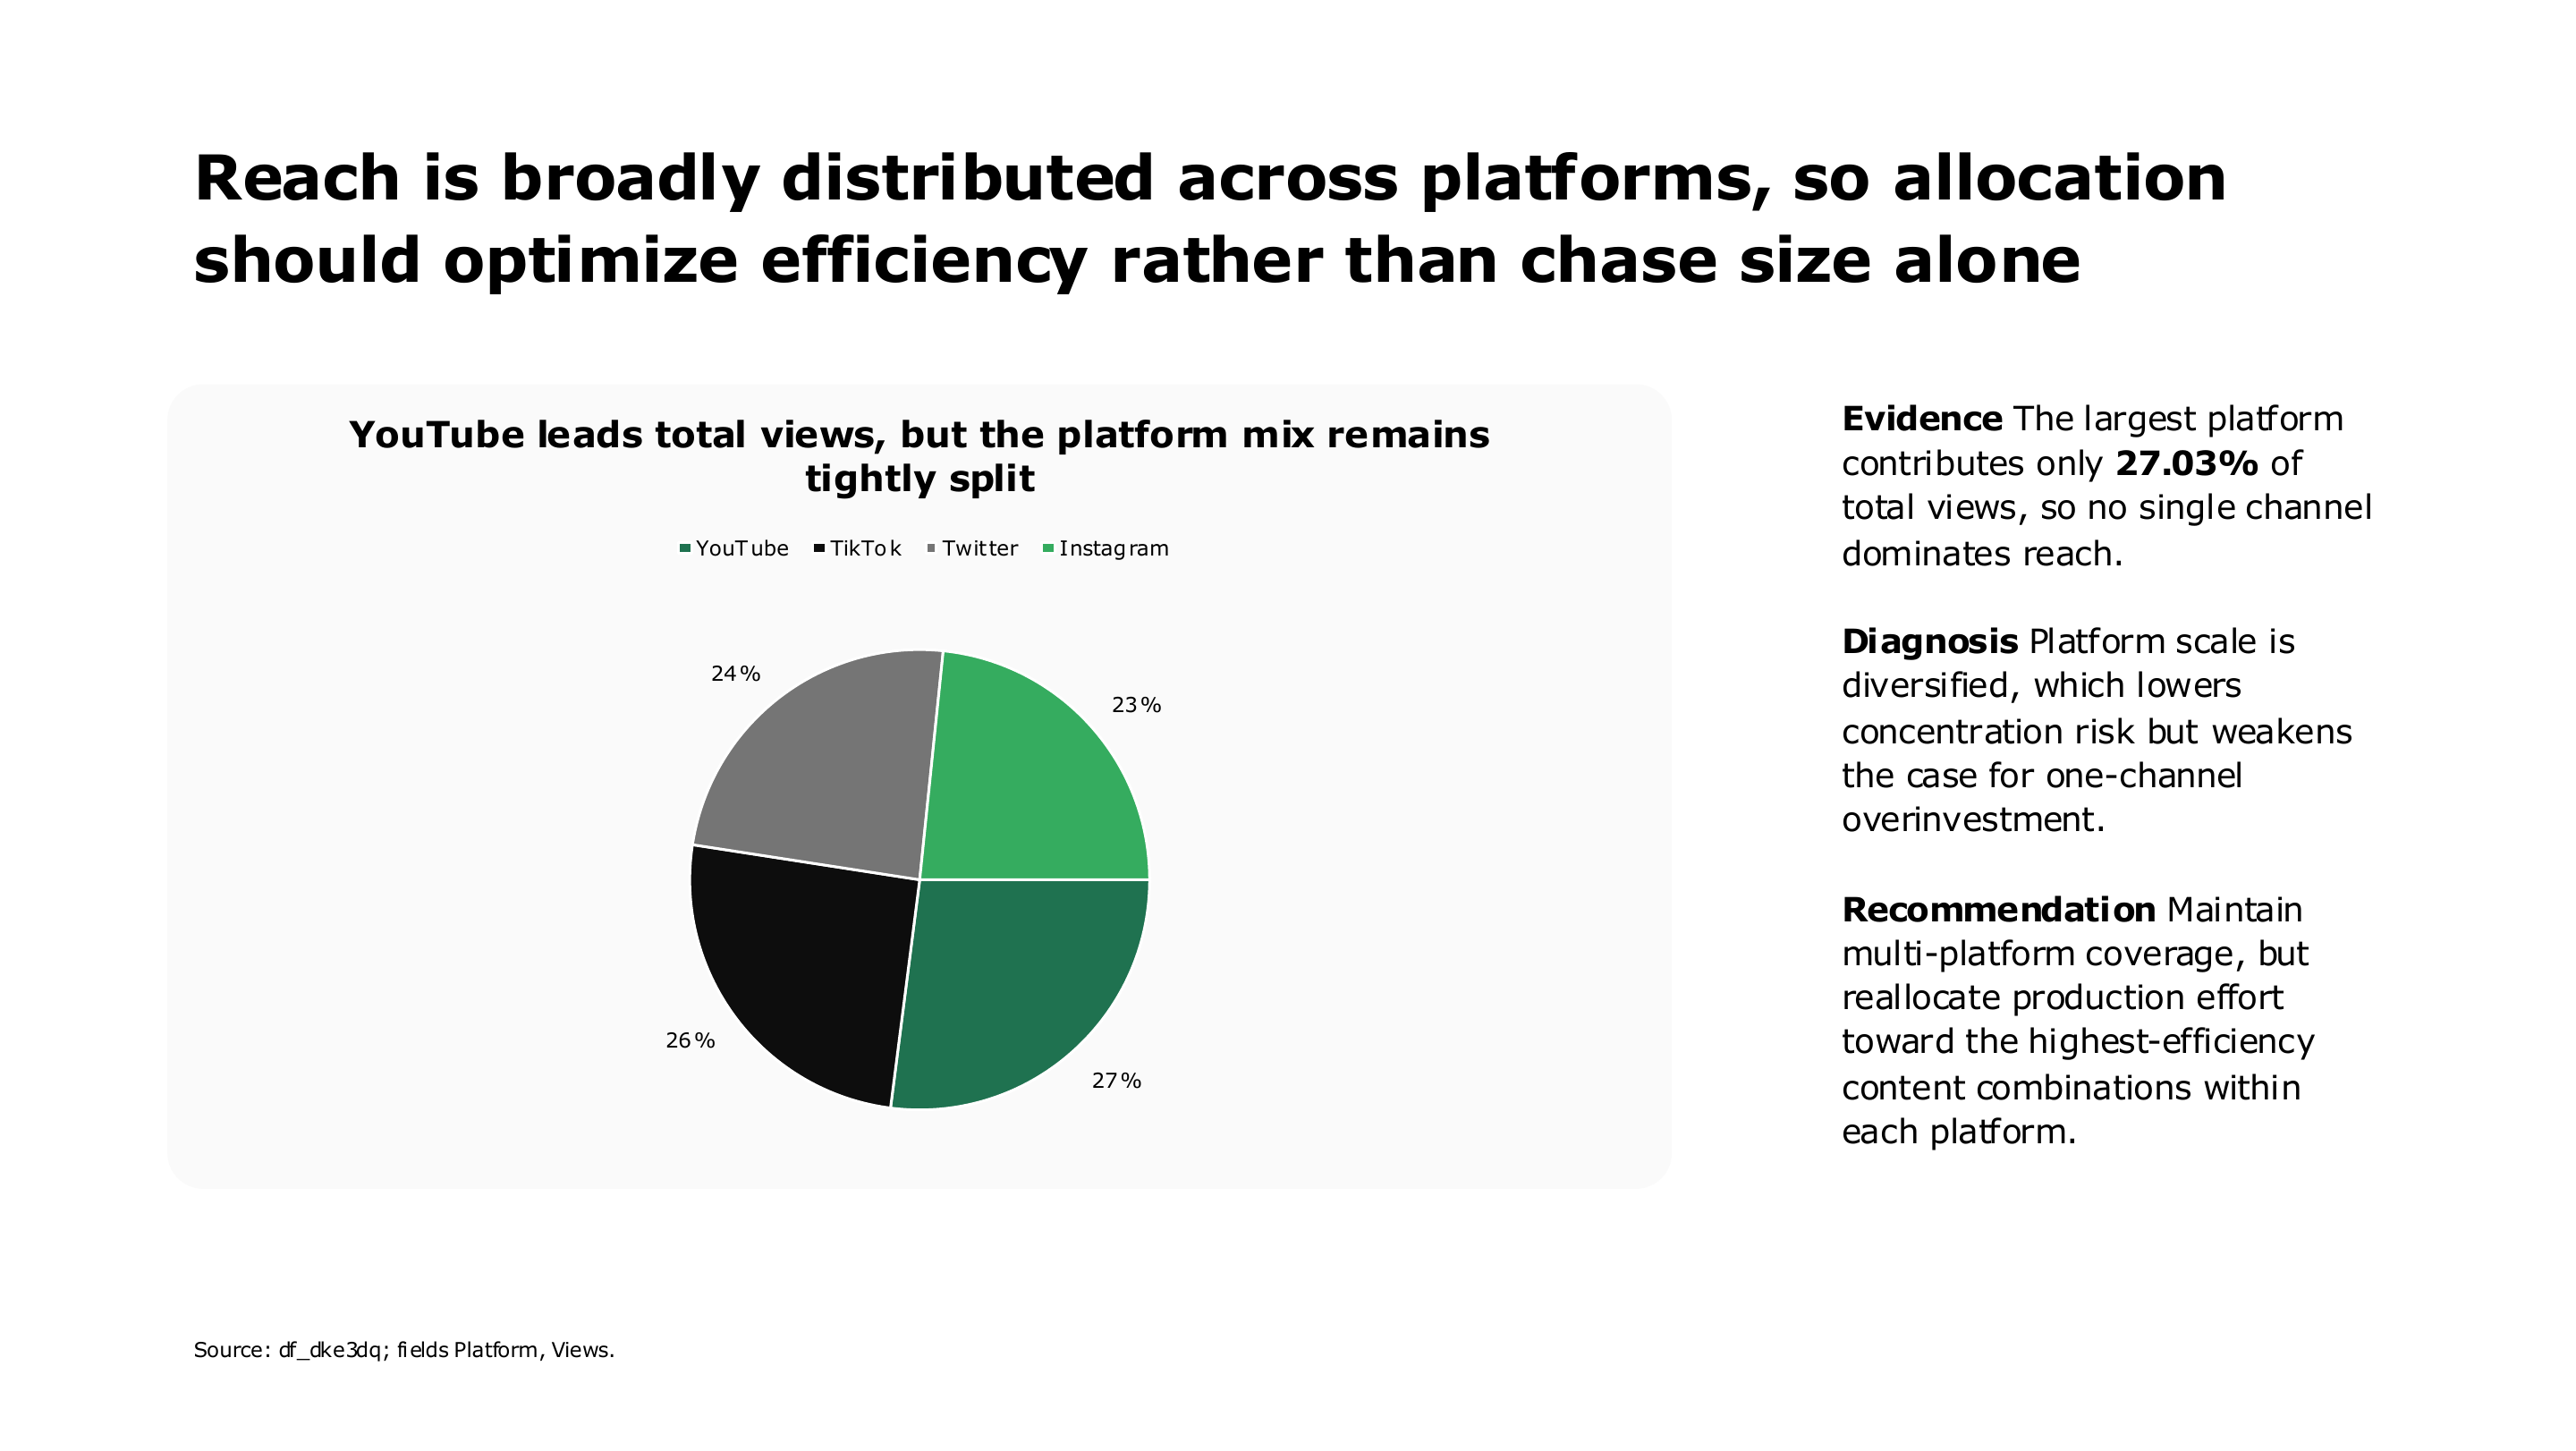
Social media platform reach allocation analysis — page 5 of 16
Social media platform reach allocation analysis
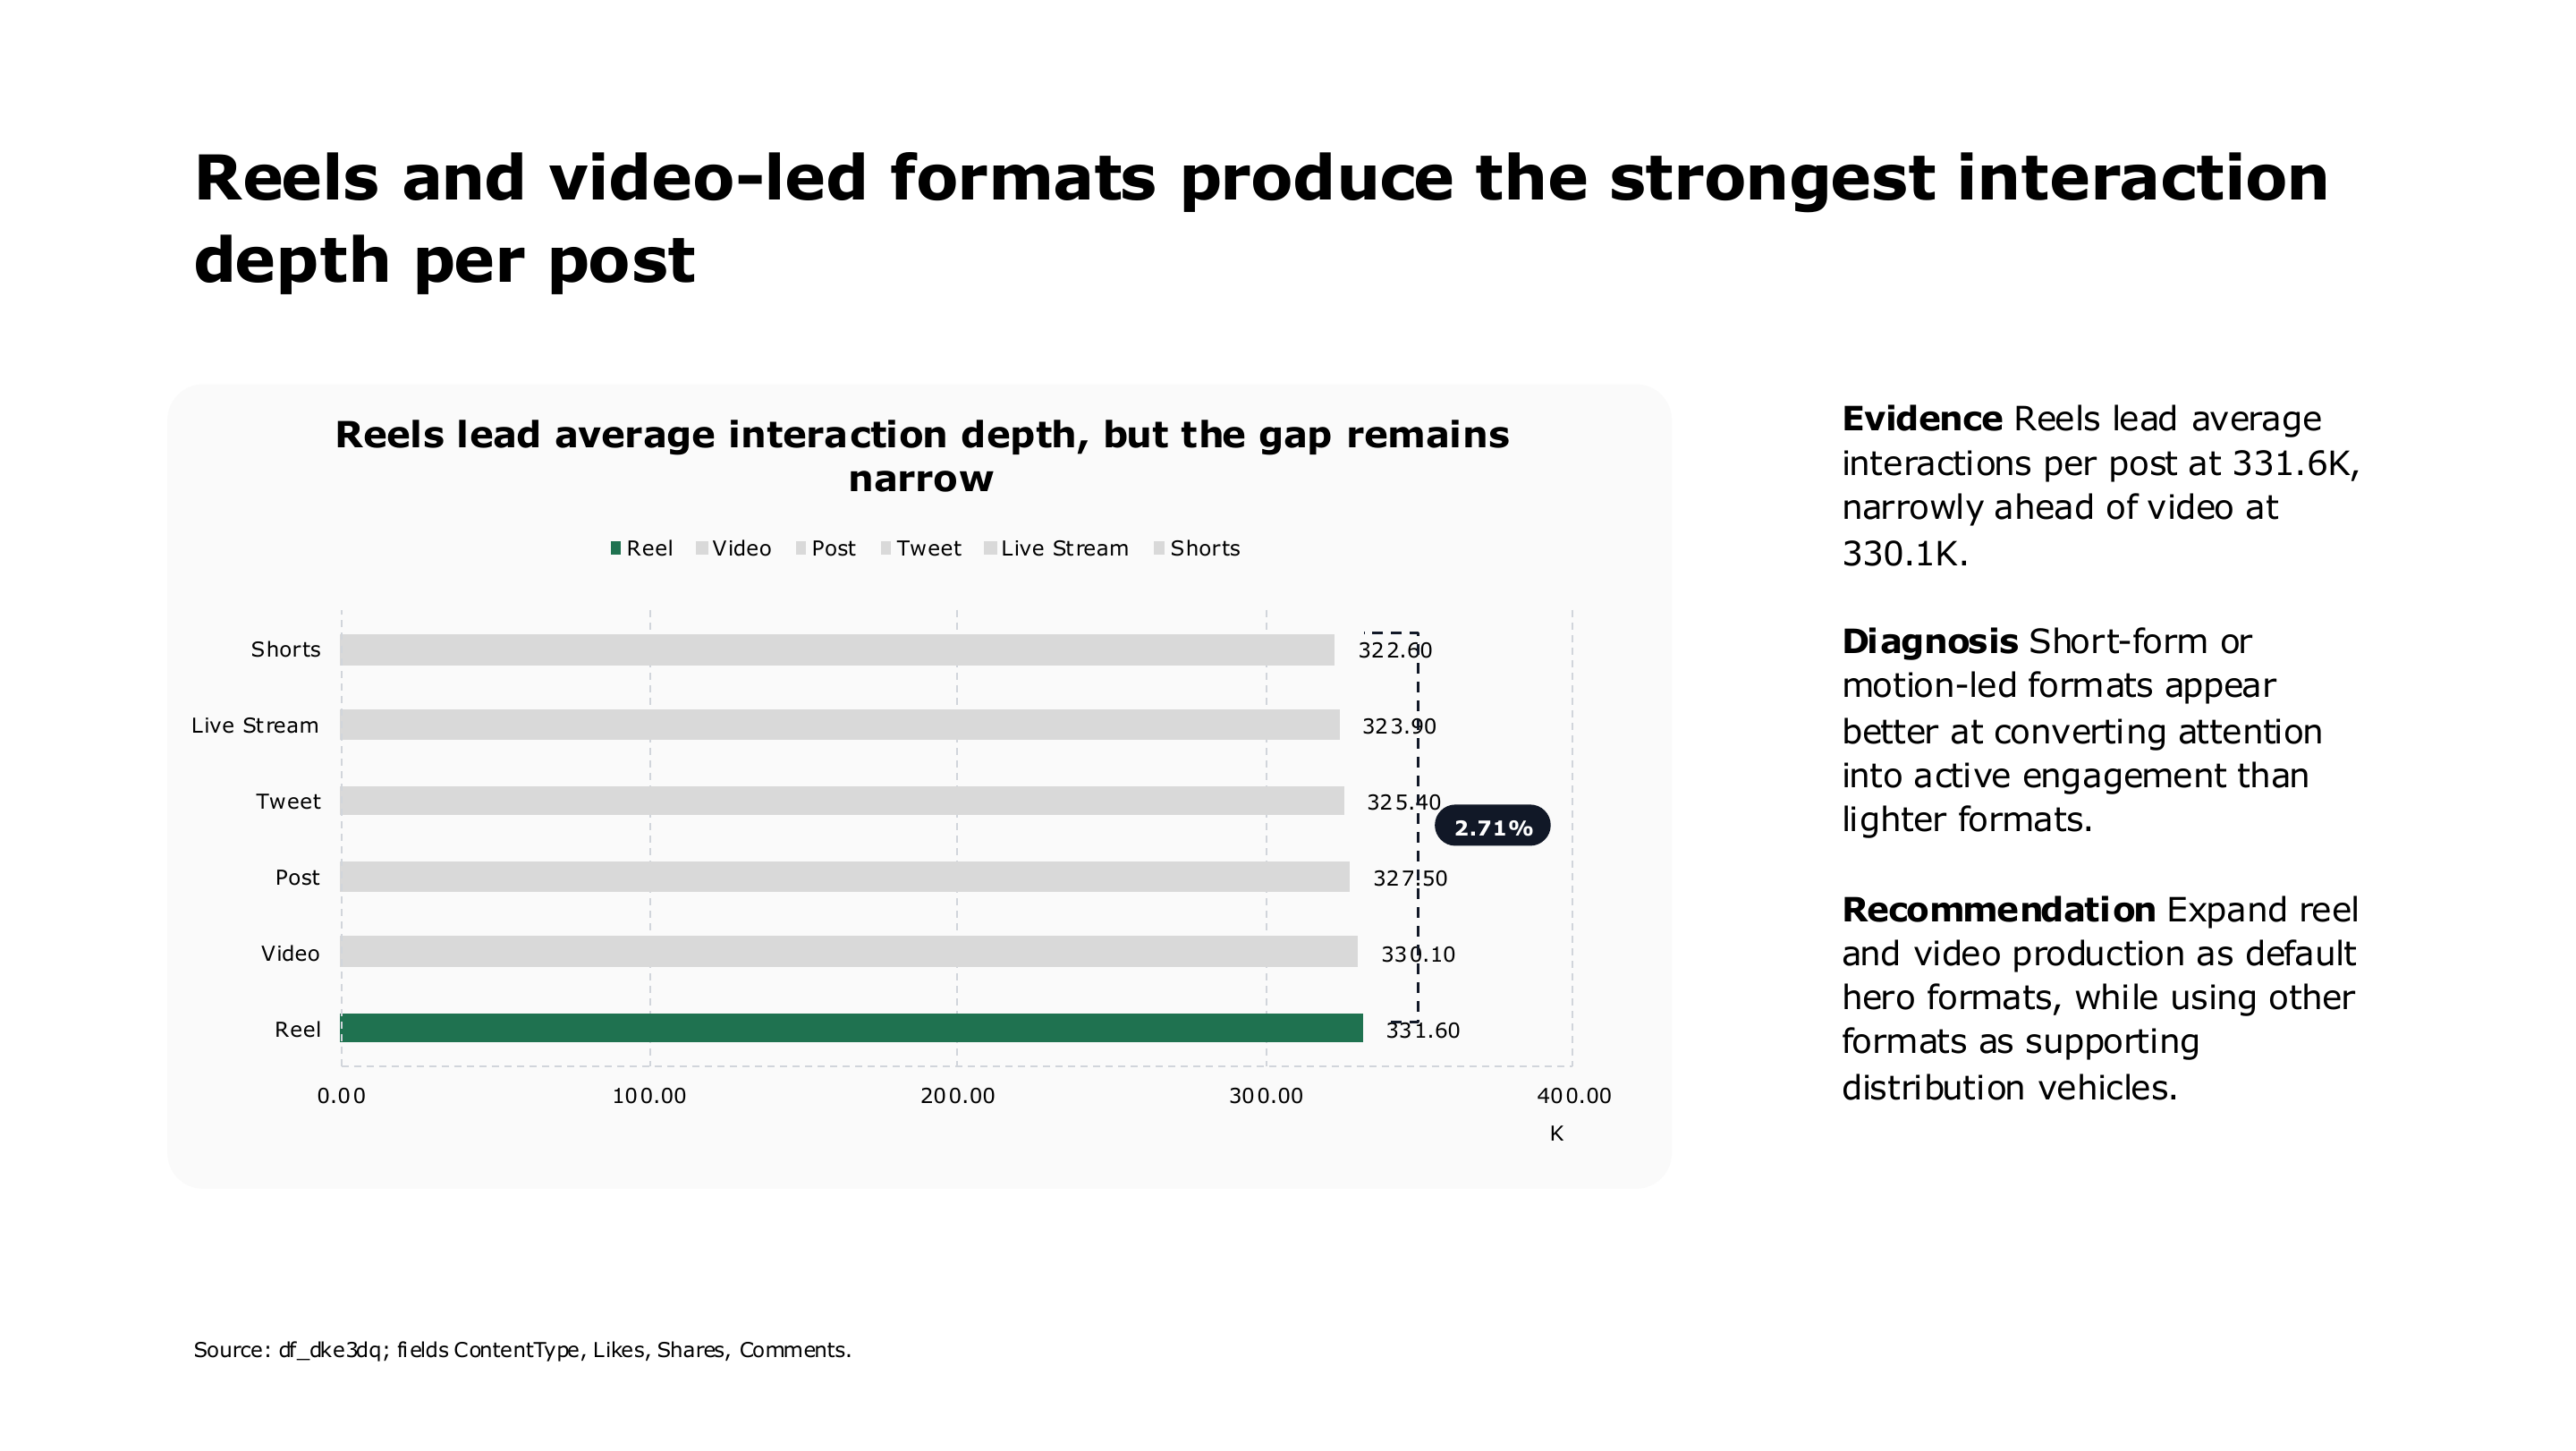
Reels and video format engagement performance — page 6 of 16
Reels and video format engagement performance
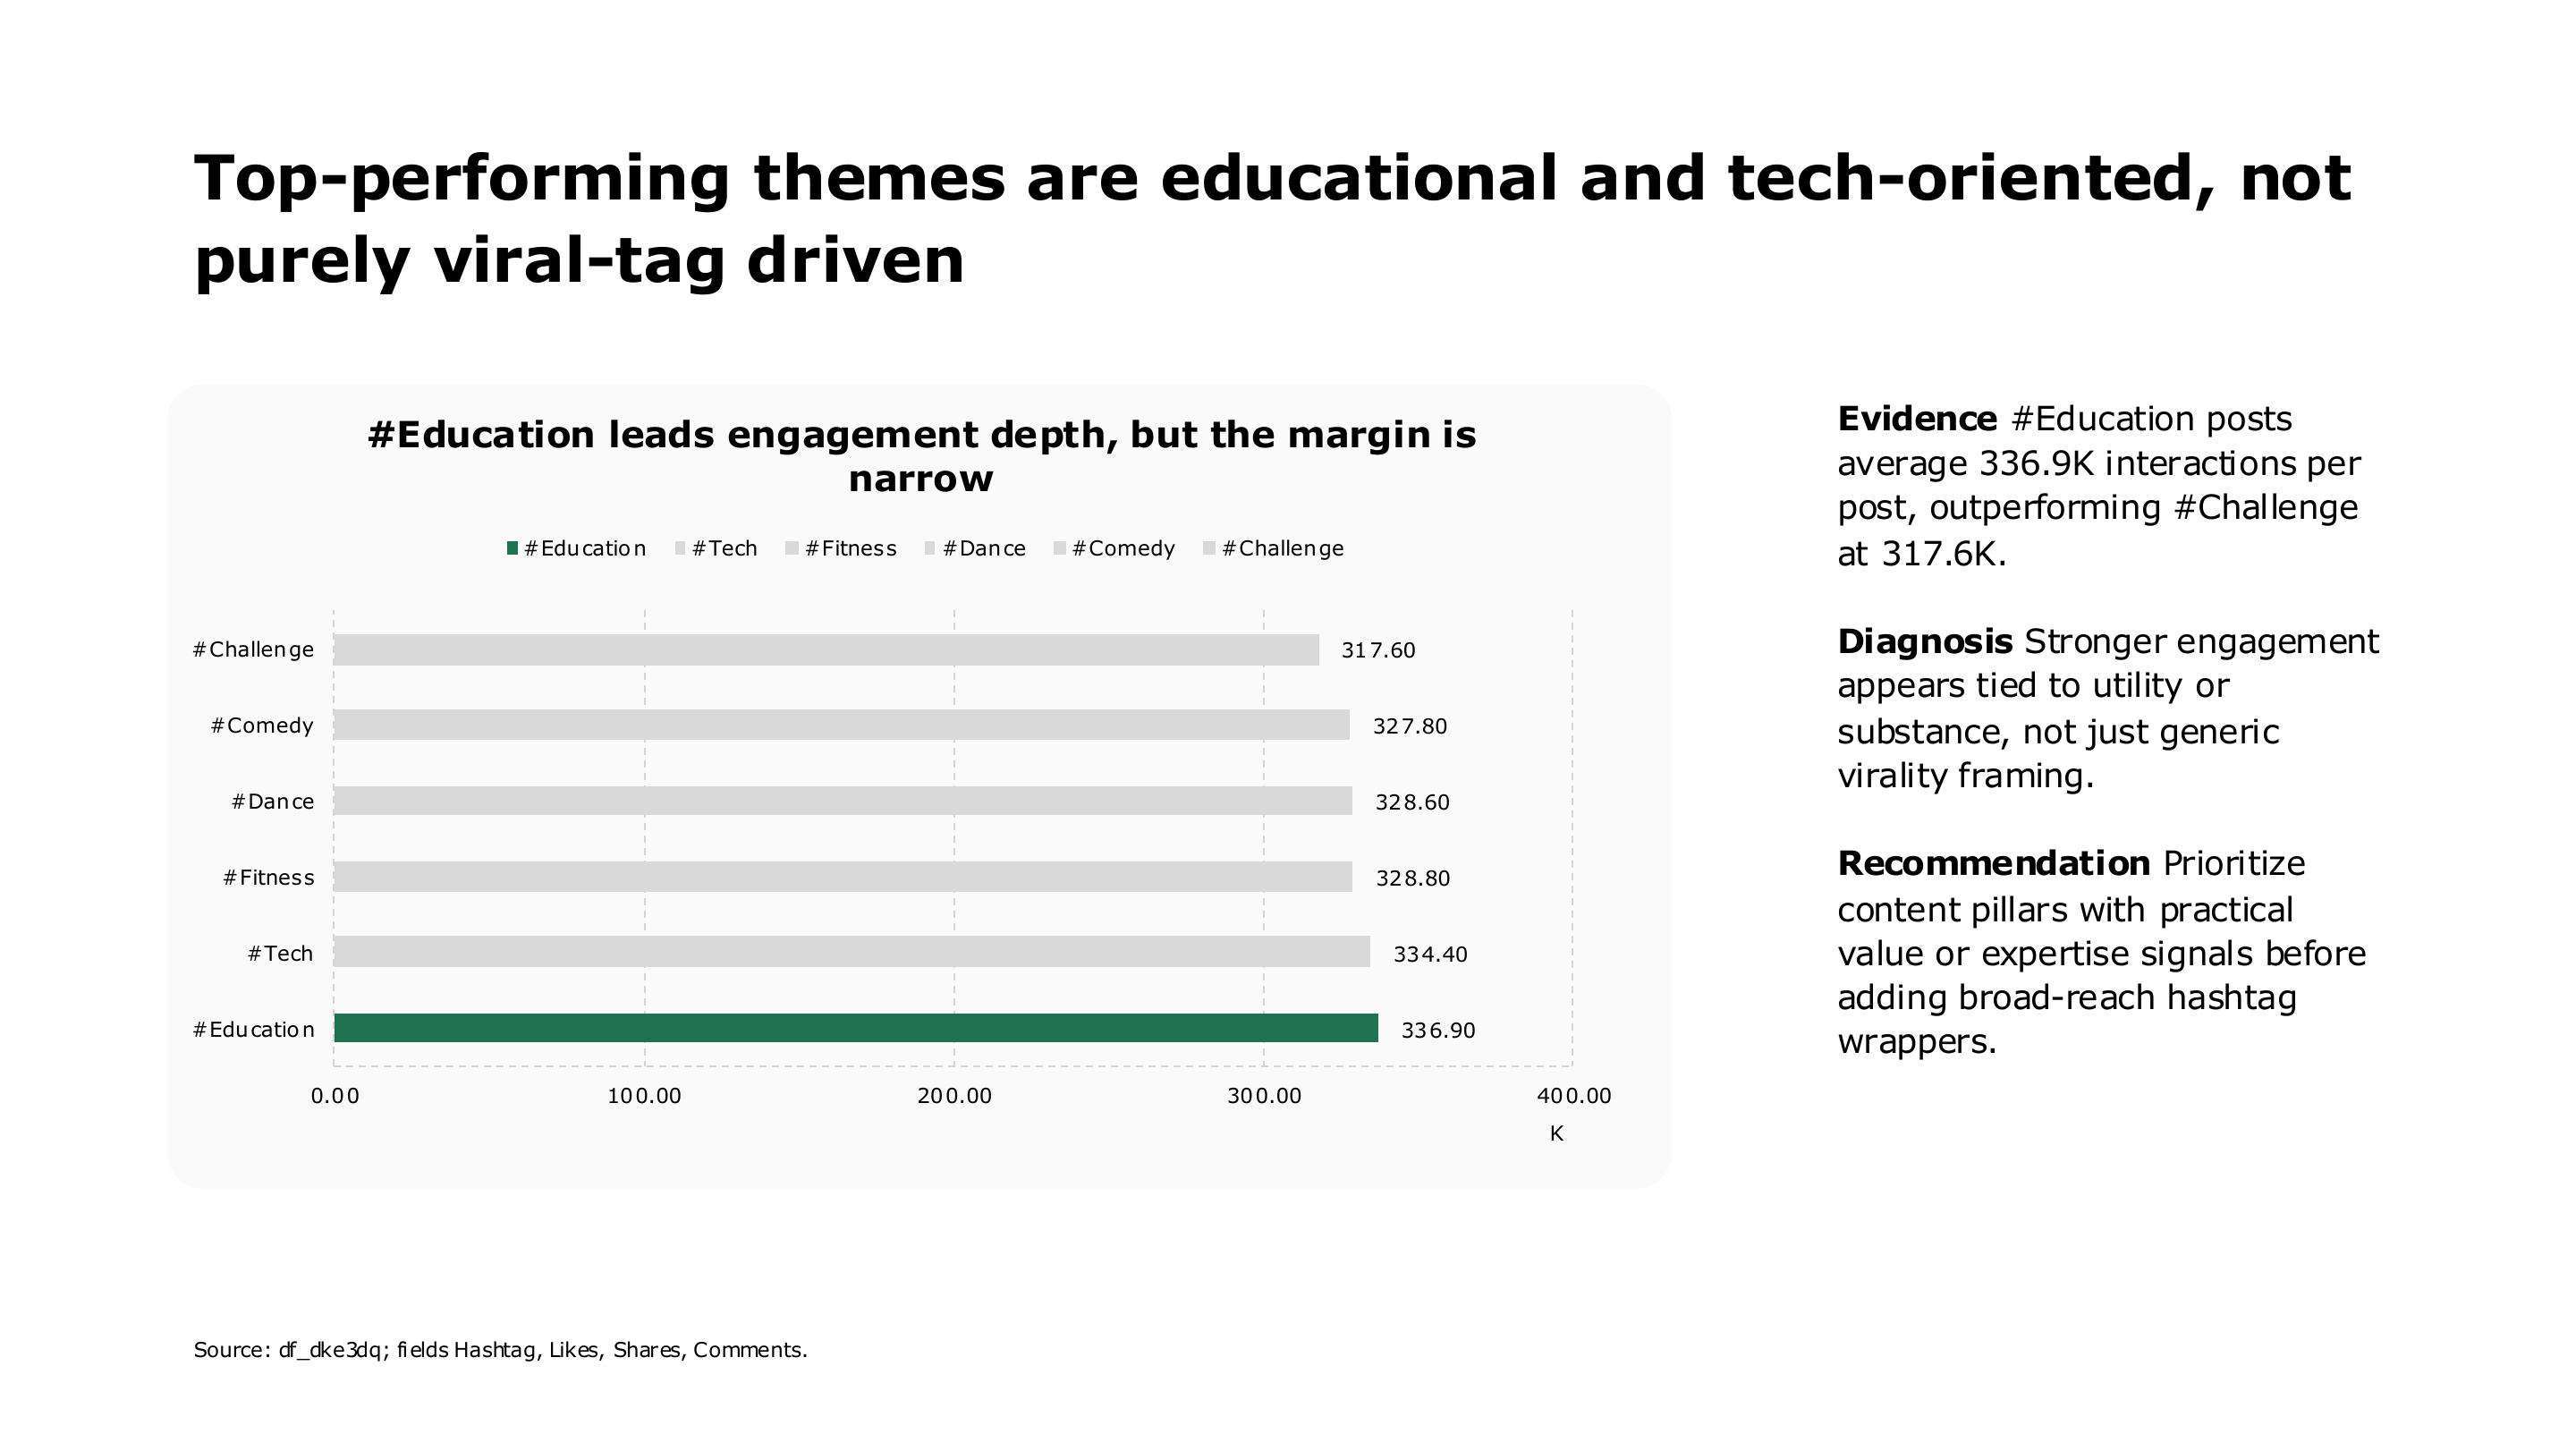
Educational and technology hashtag engagement performance — page 7 of 16
Educational and technology hashtag engagement performance
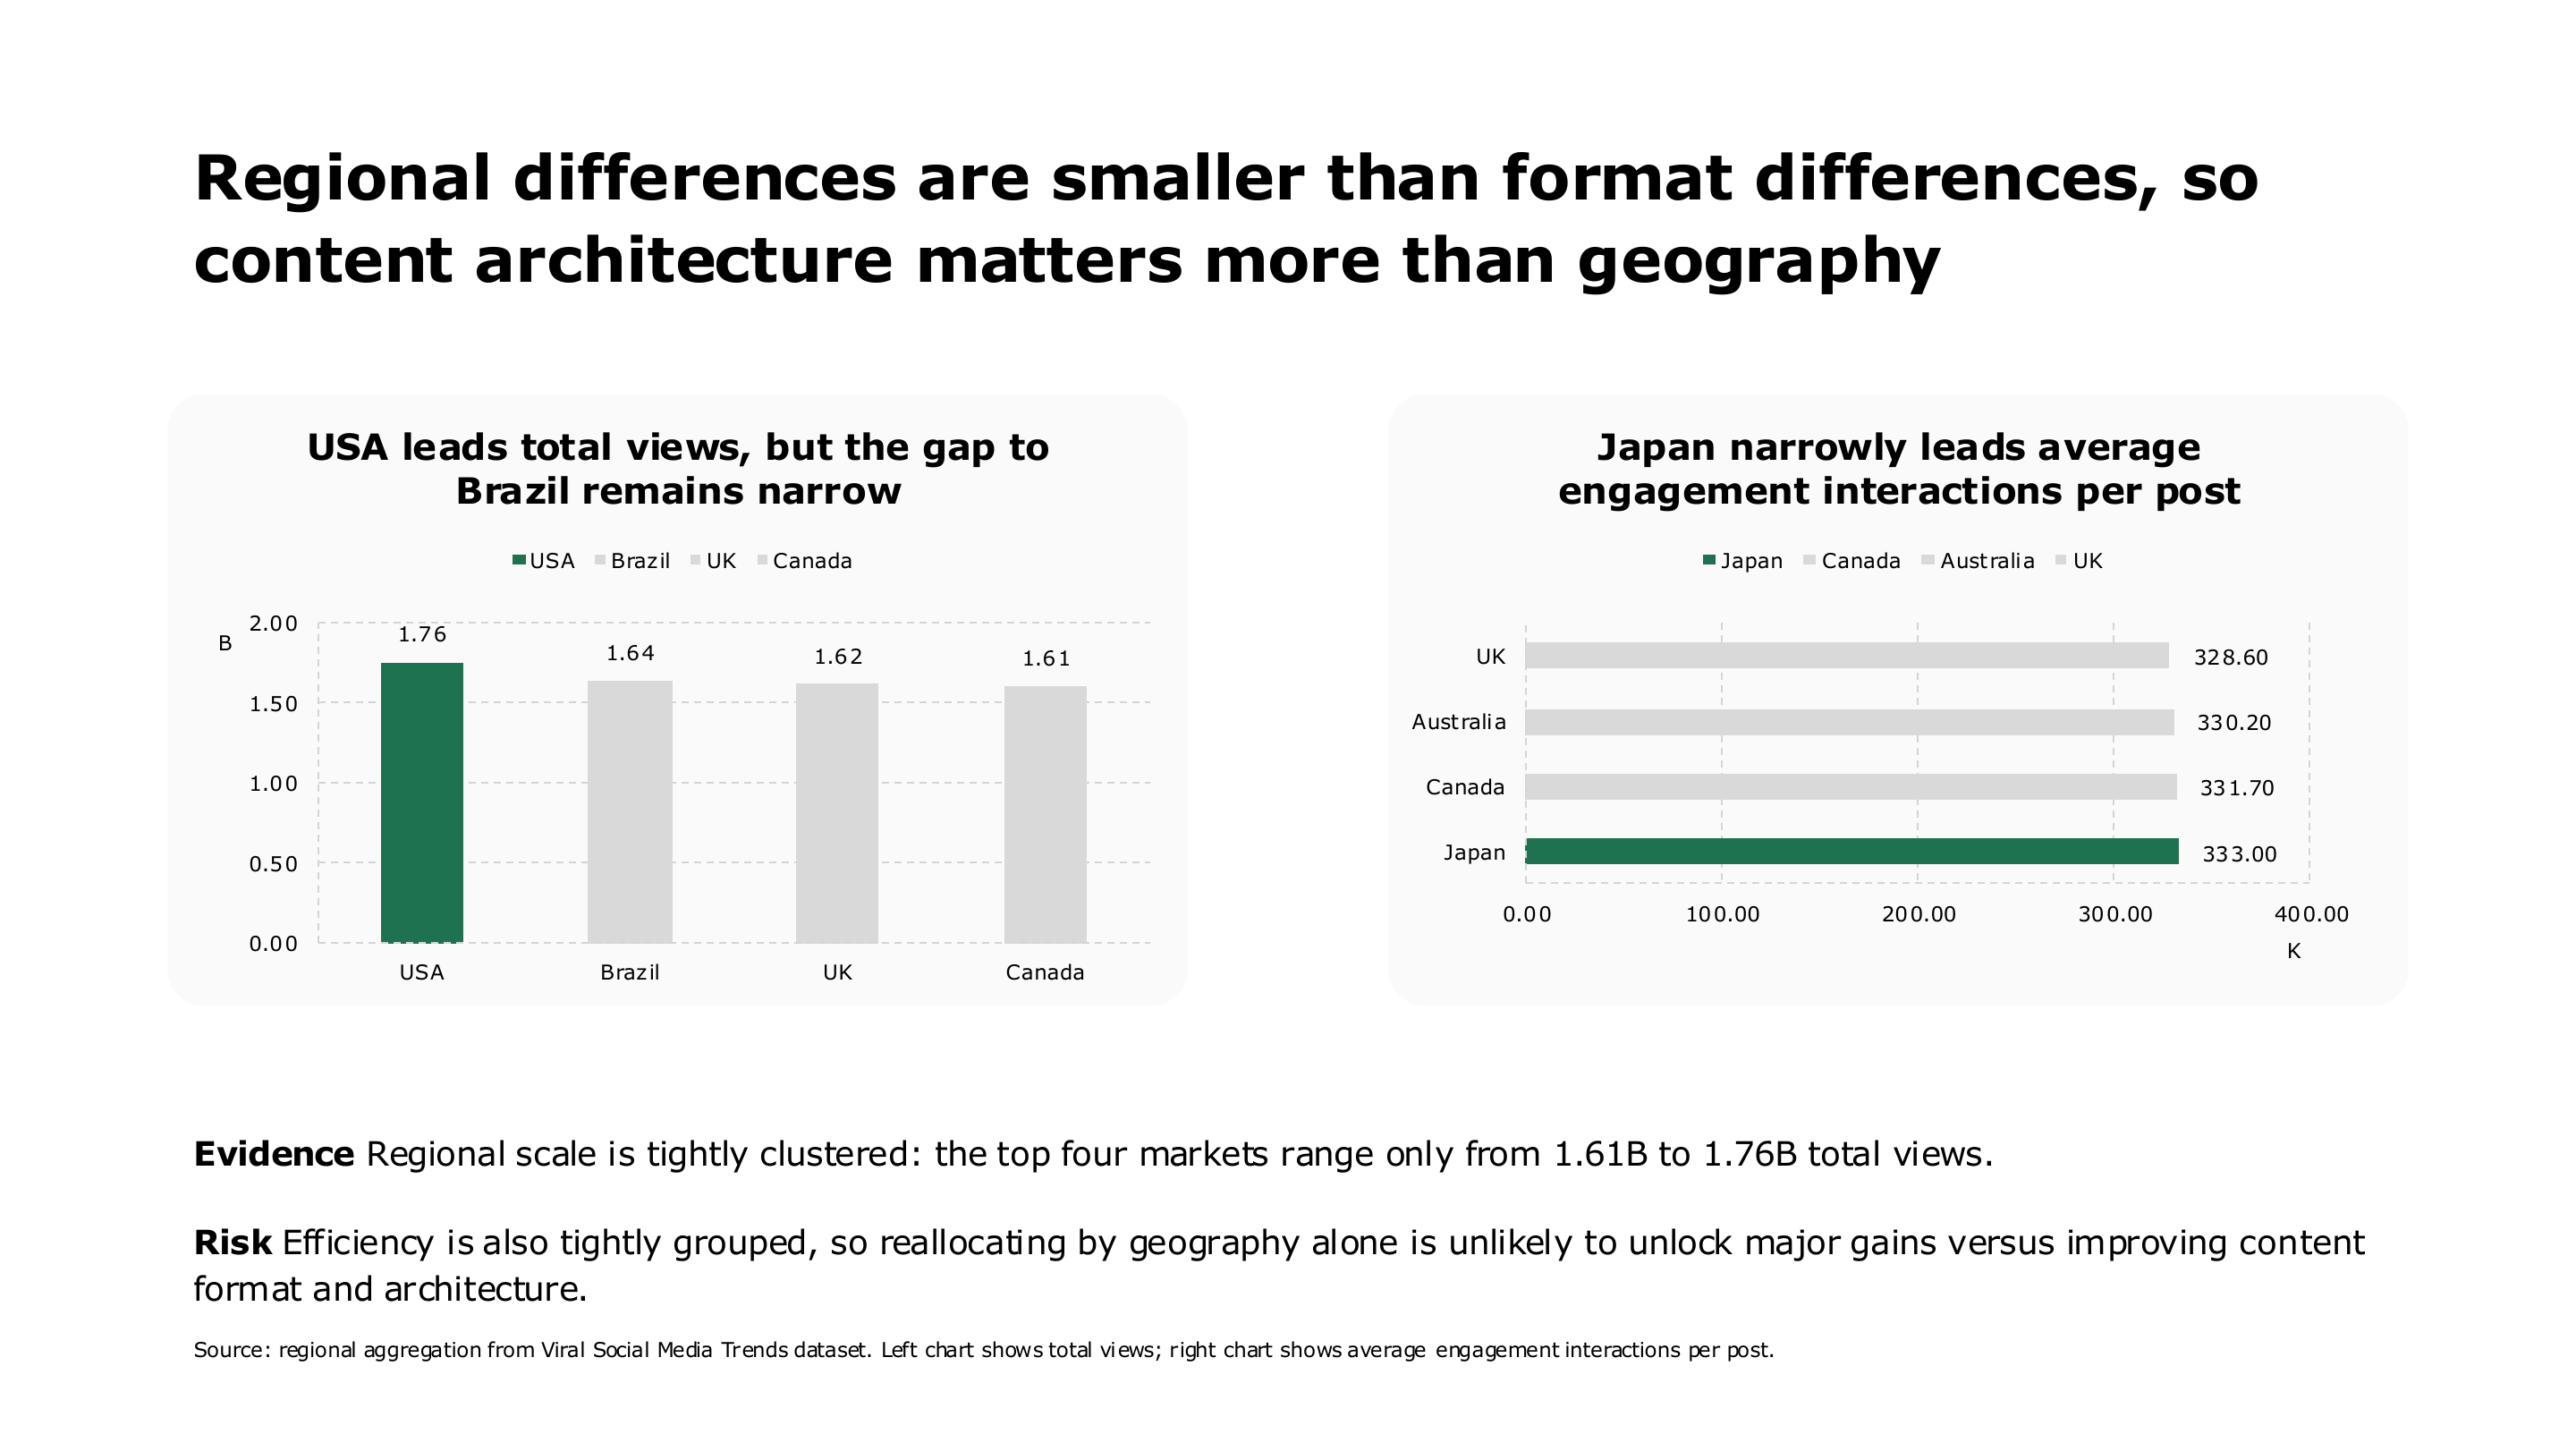
Regional social media reach and engagement comparison — page 8 of 16
Regional social media reach and engagement comparison
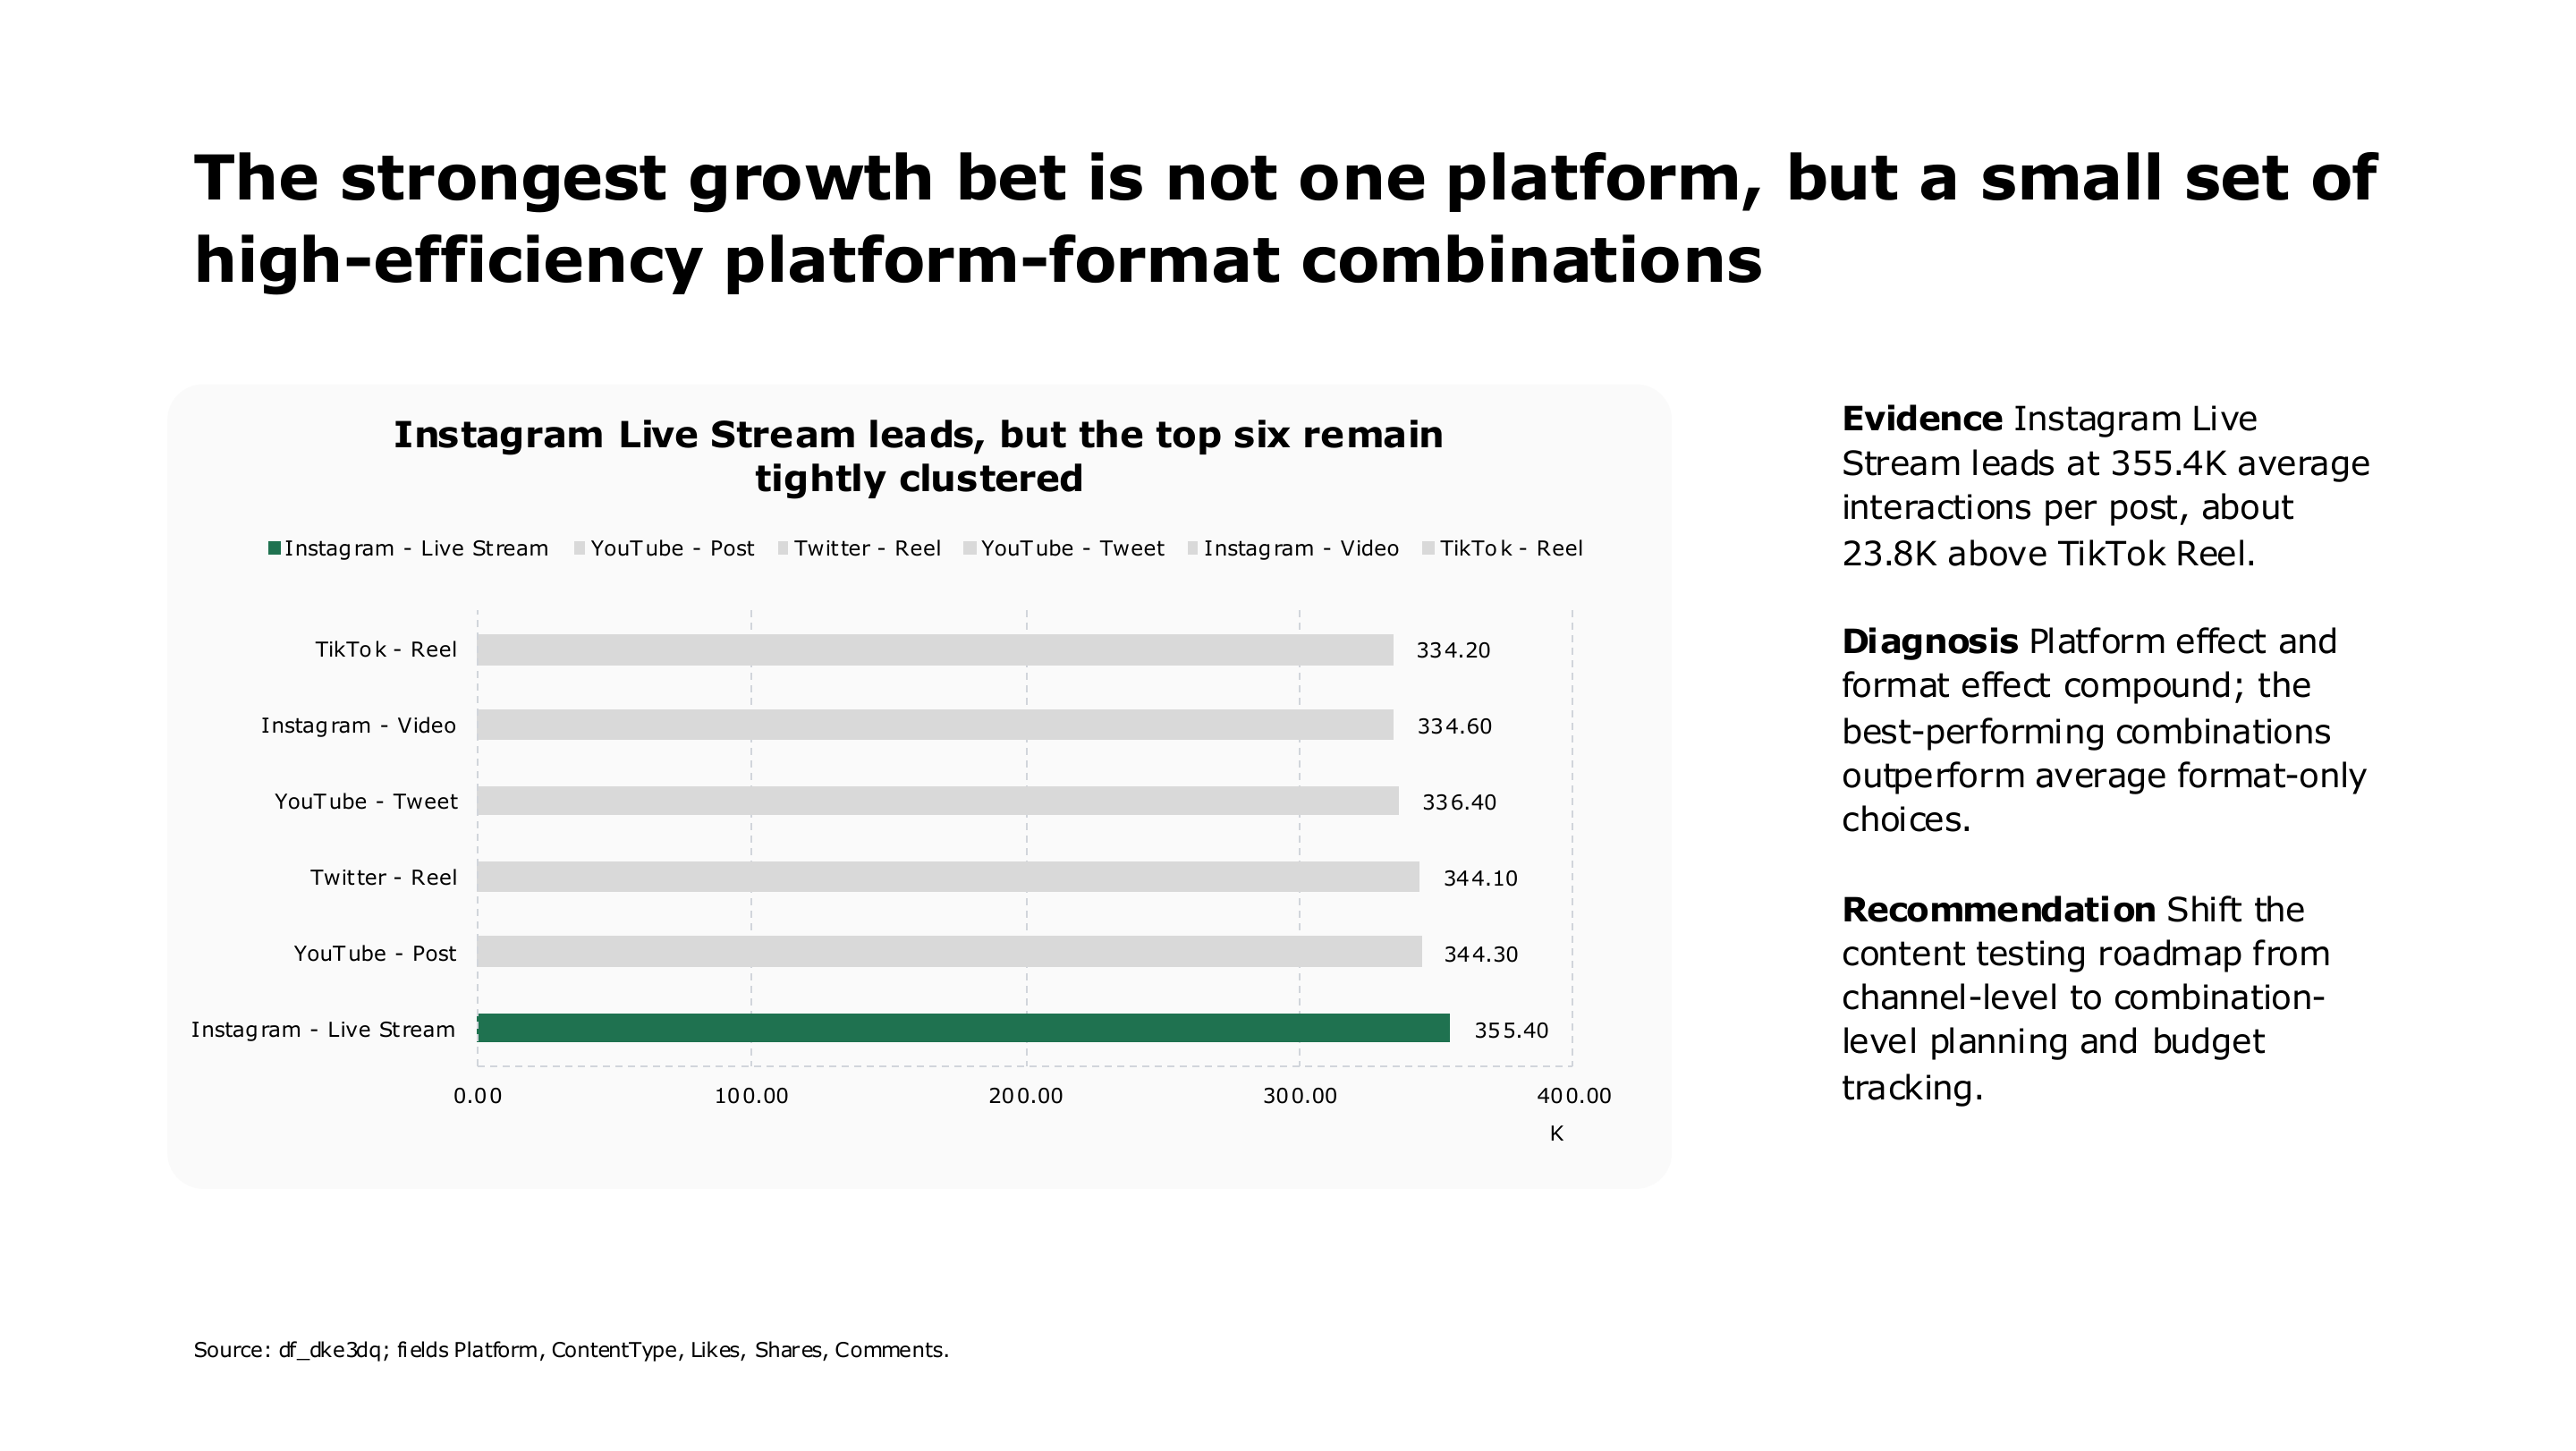
High-efficiency platform and content format combinations — page 9 of 16
High-efficiency platform and content format combinations
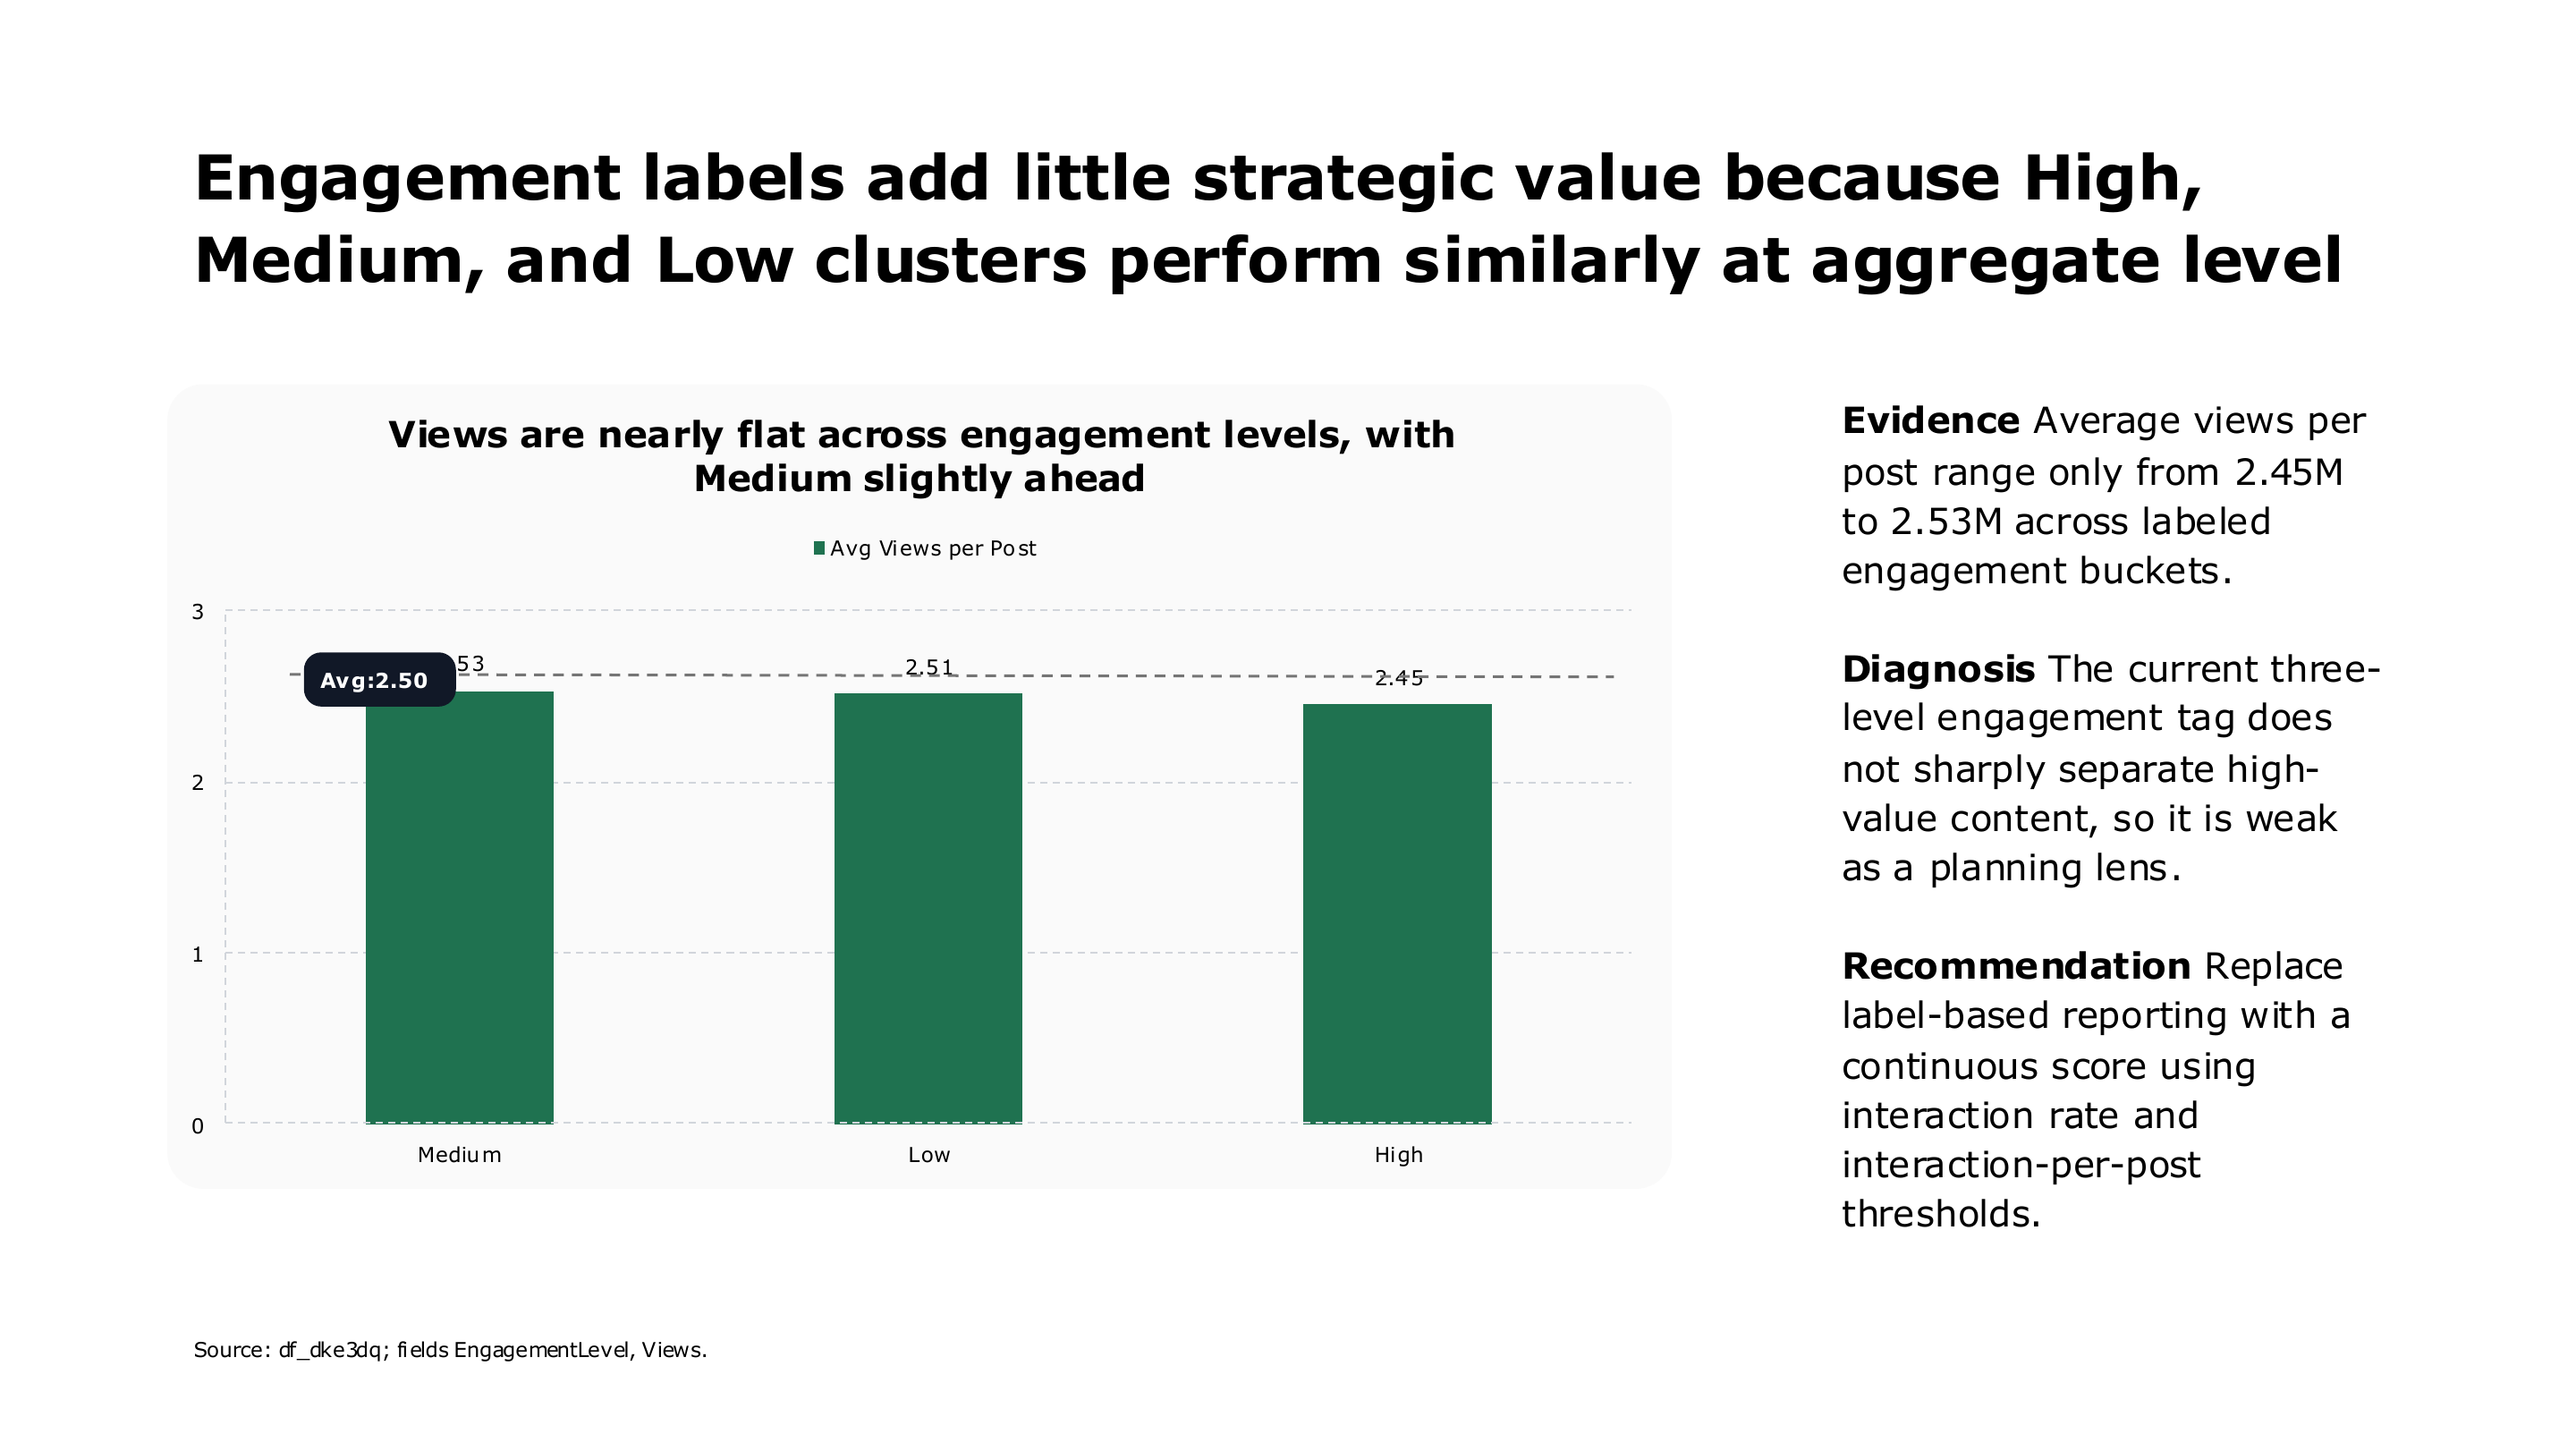
Engagement label effectiveness analysis — page 10 of 16
Engagement label effectiveness analysis
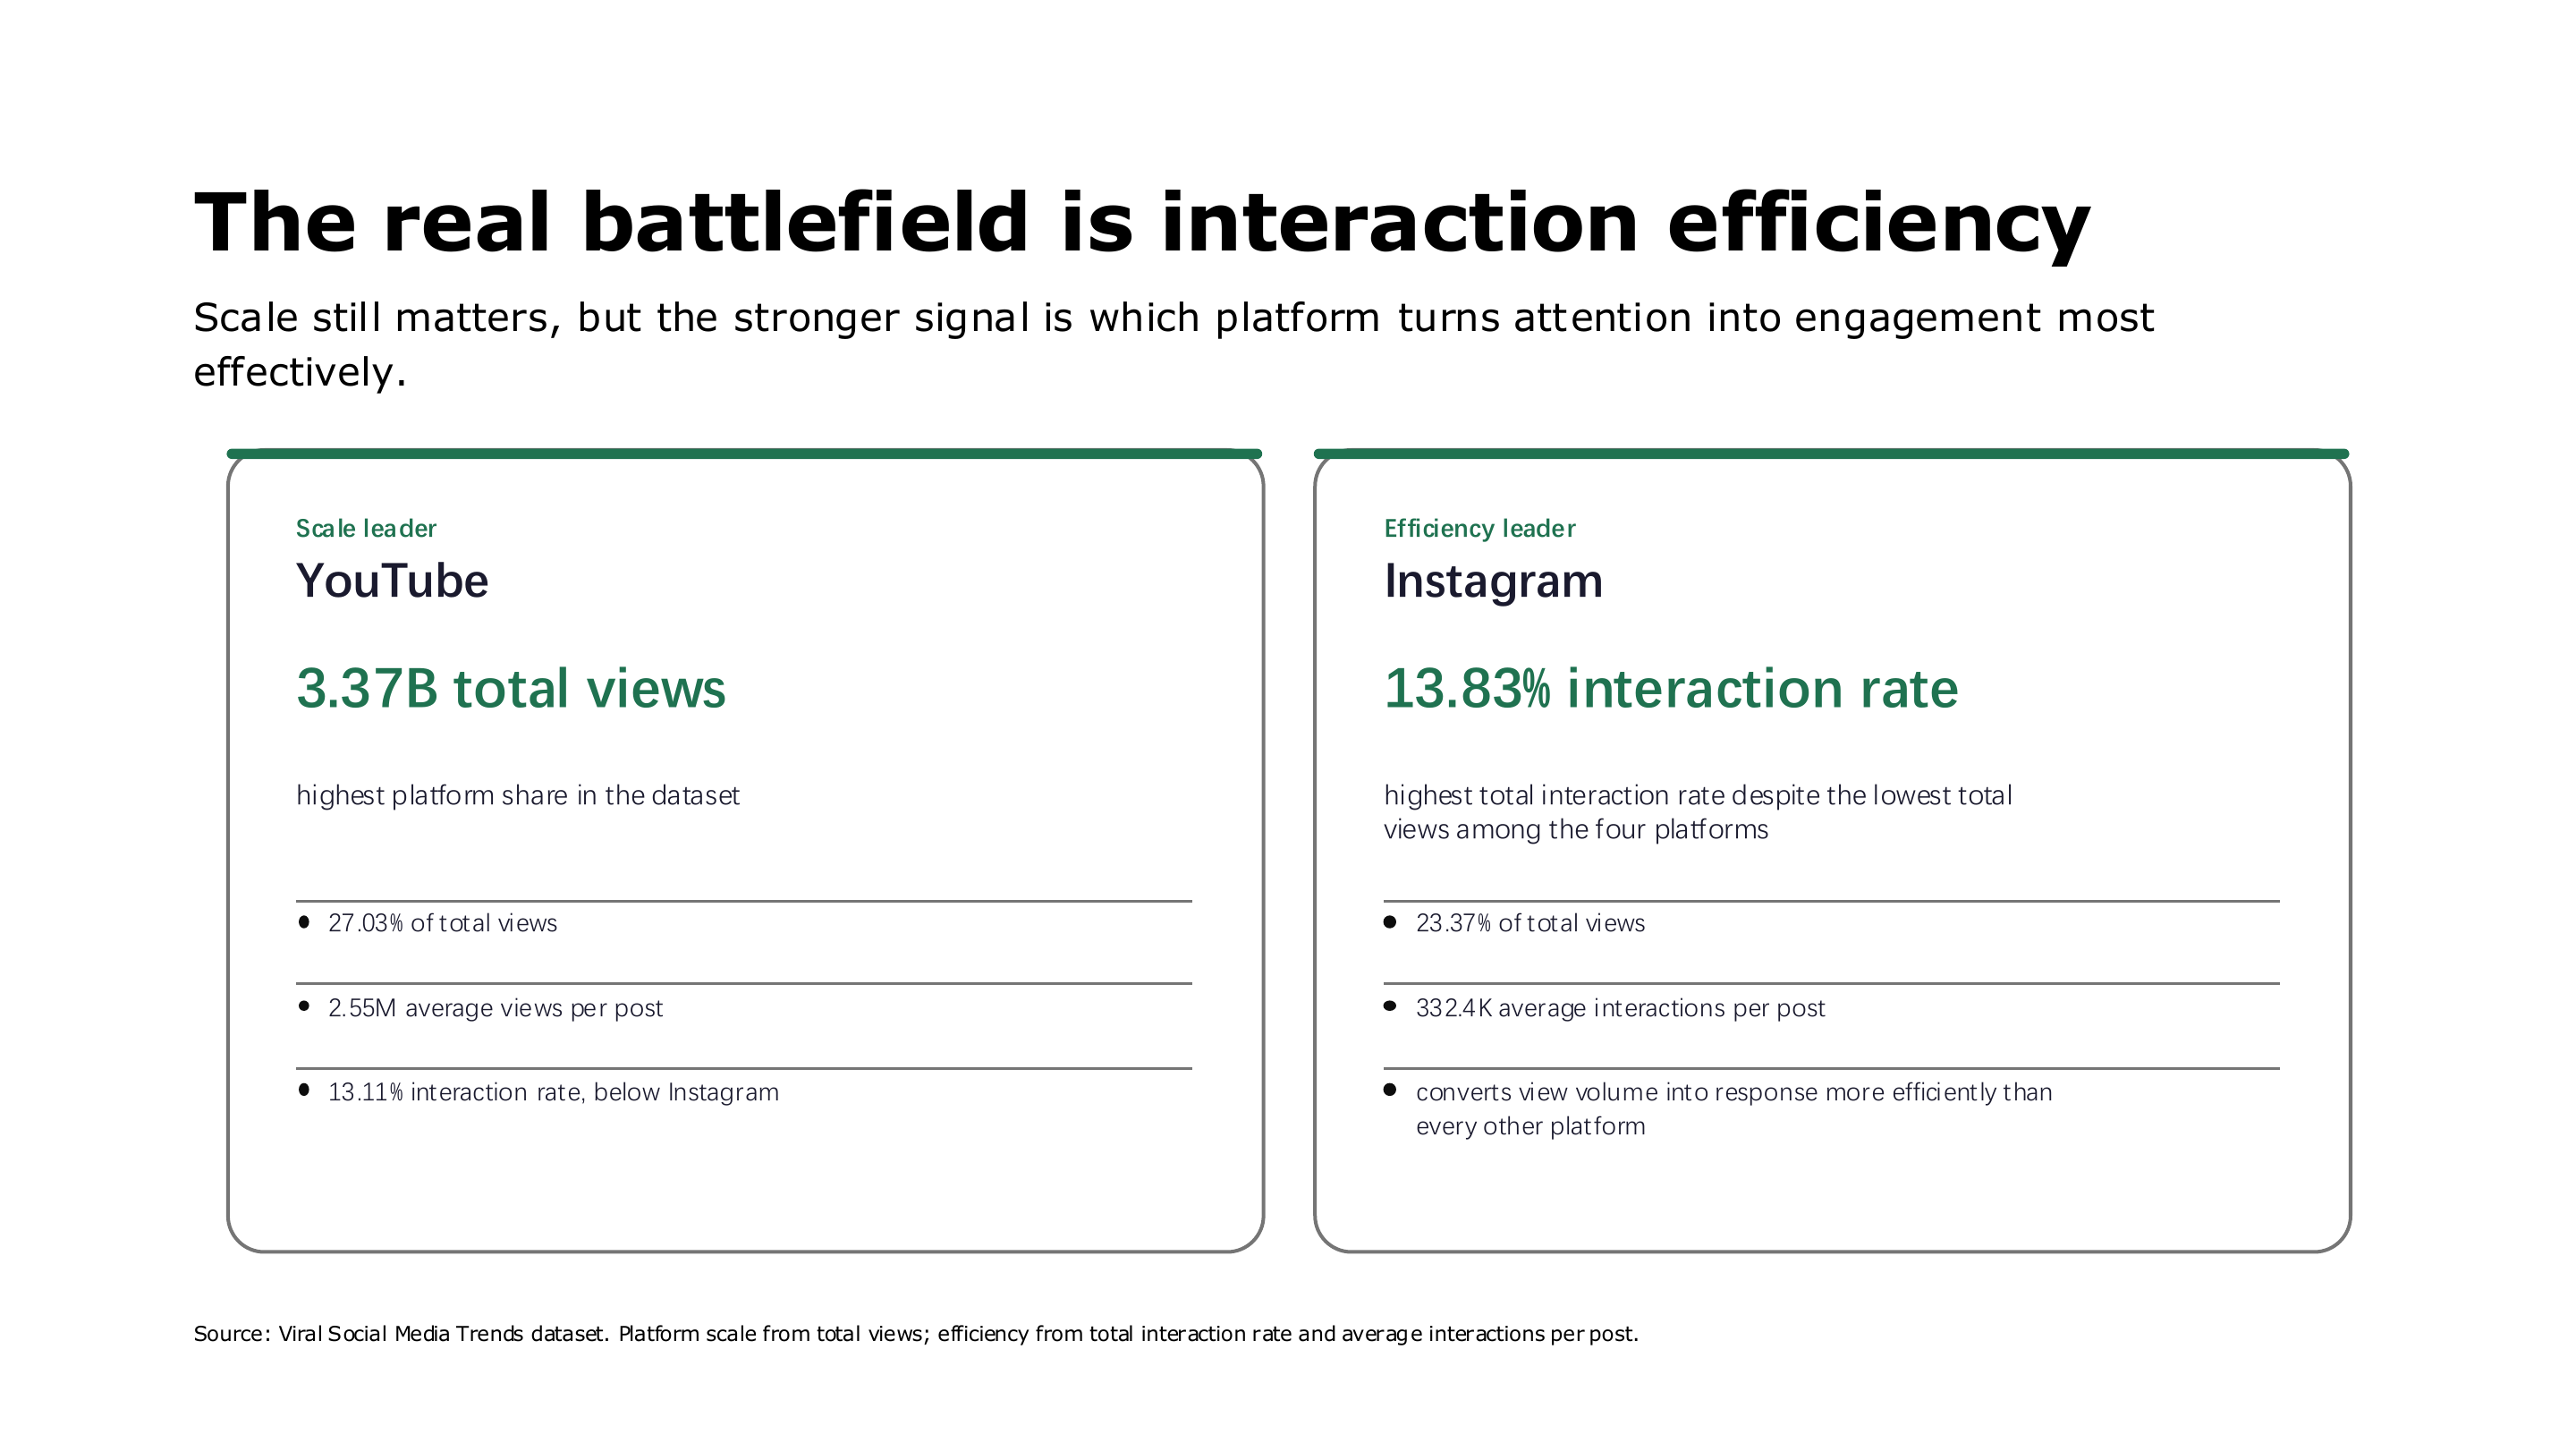
Social media scale versus interaction efficiency — page 11 of 16
Social media scale versus interaction efficiency
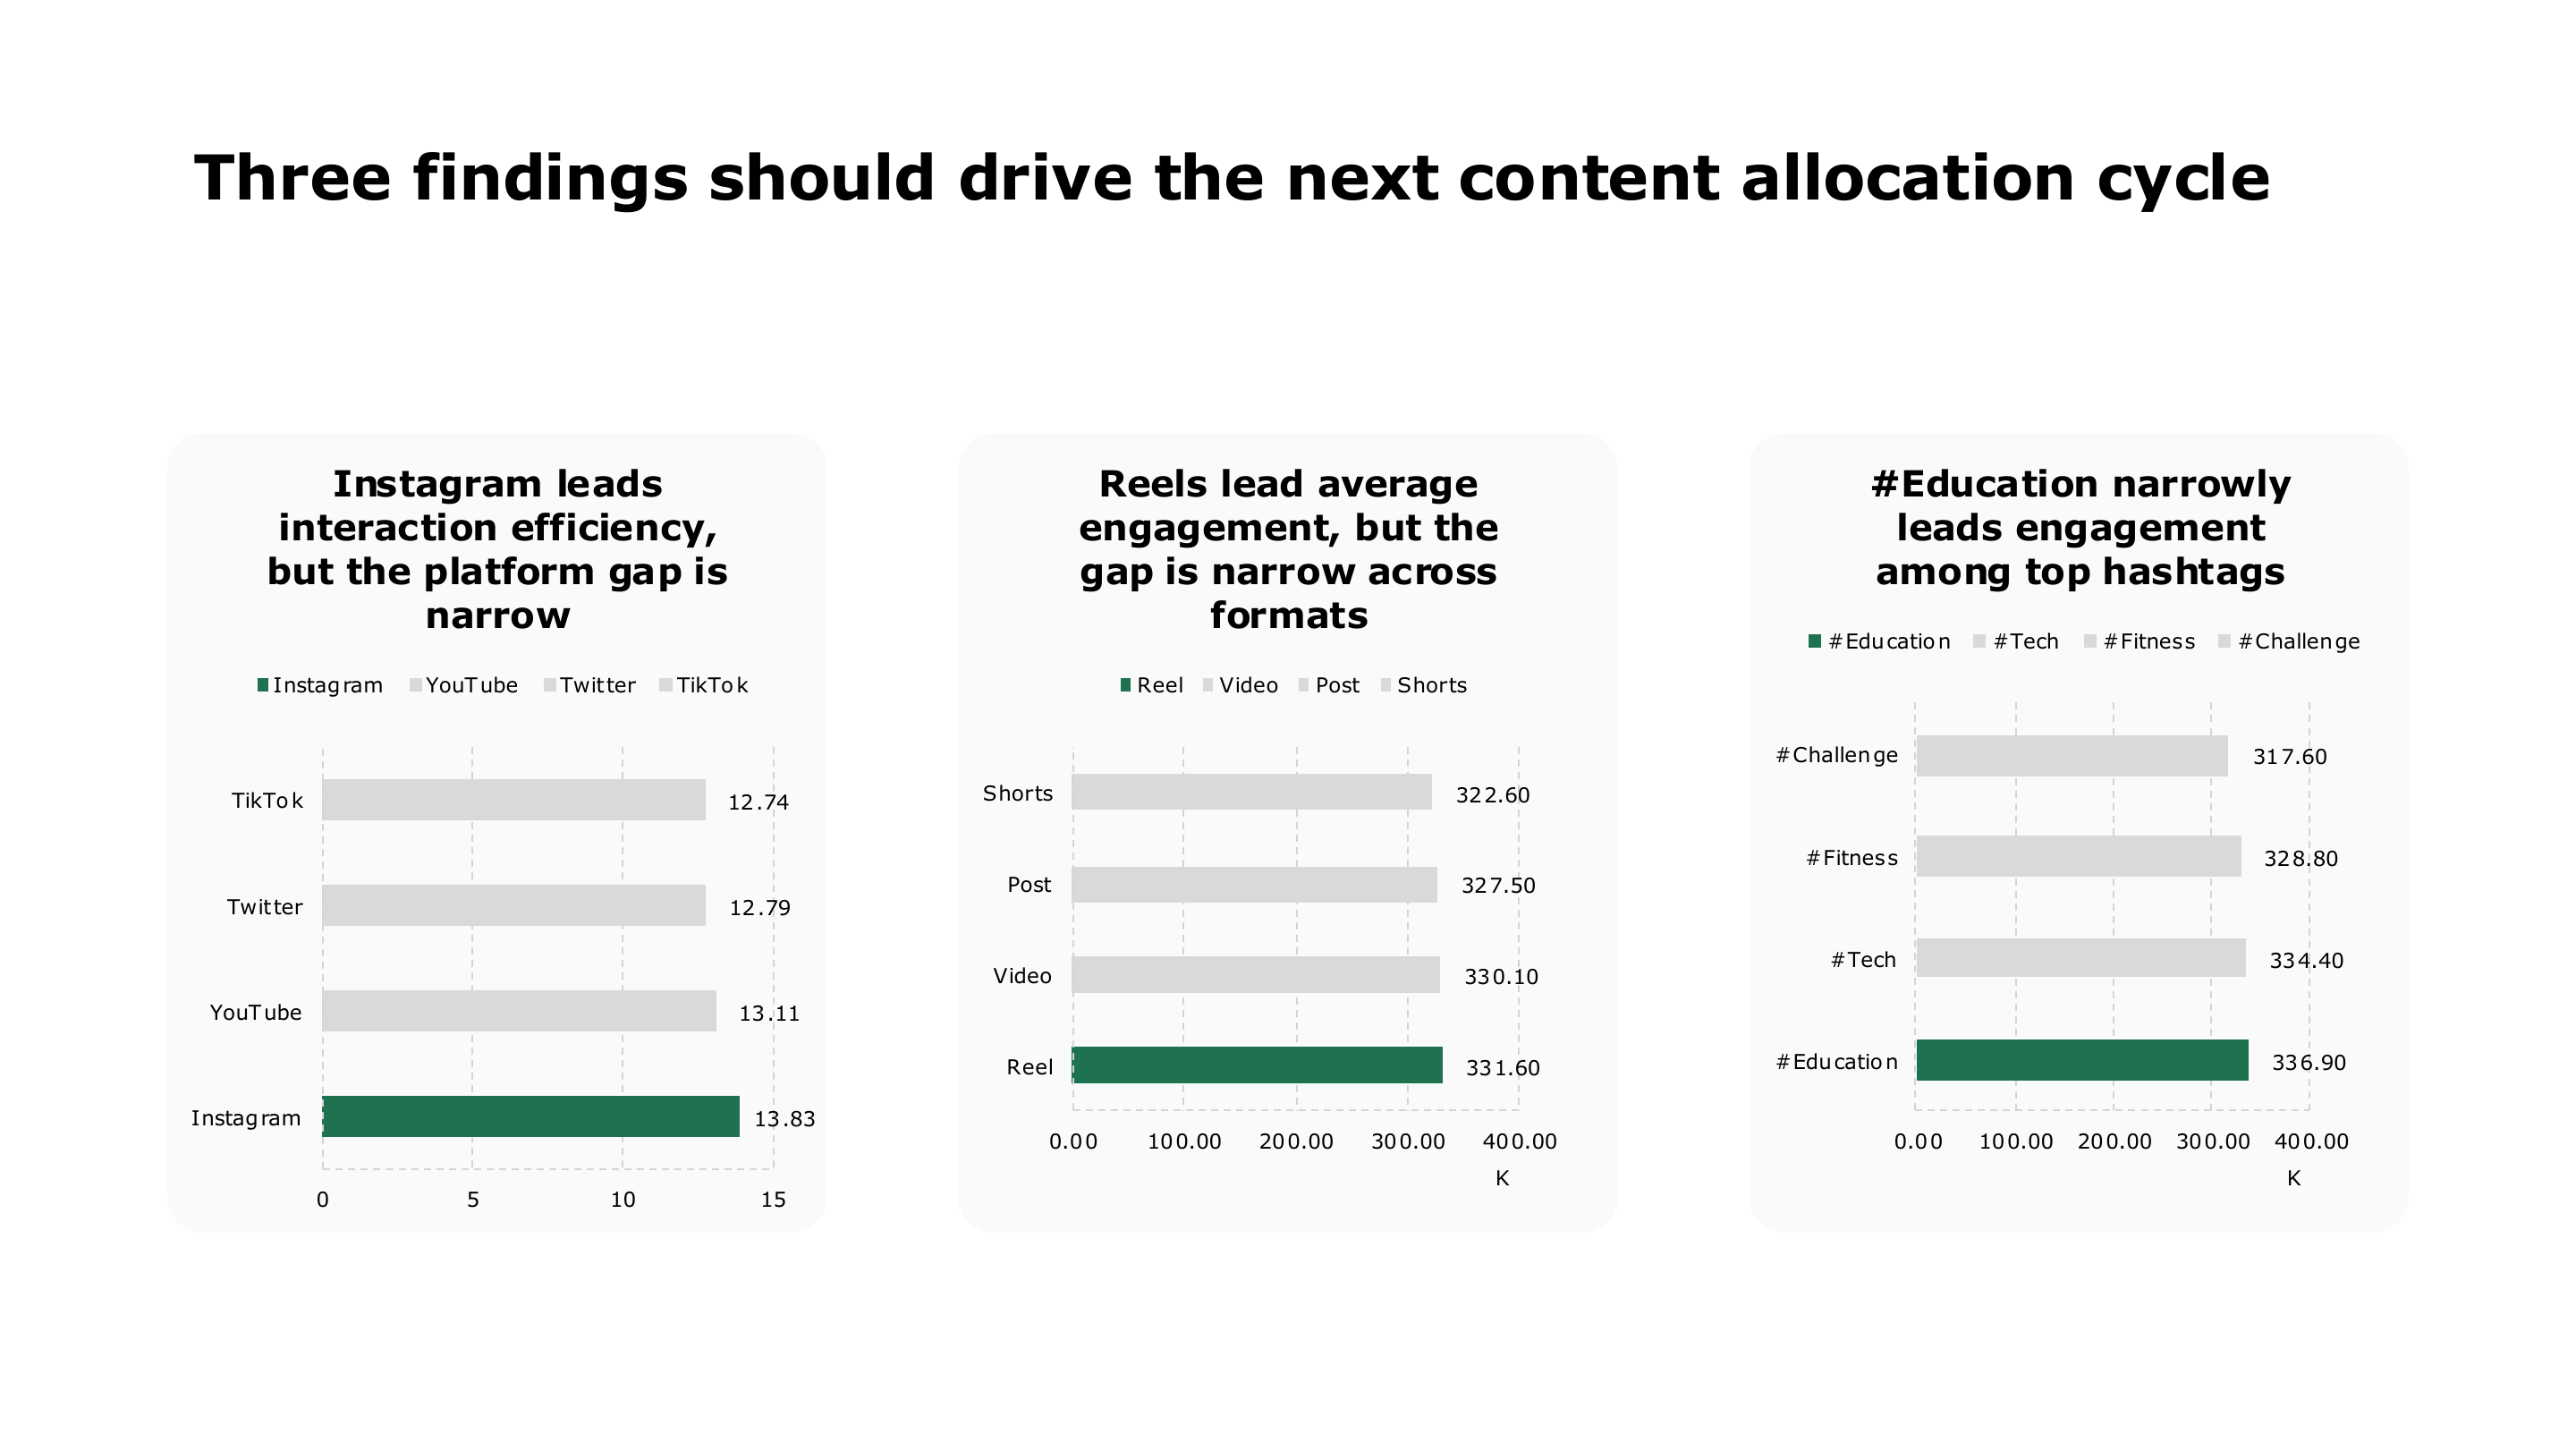
Key findings for platform, format, and hashtag performance — page 12 of 16
Key findings for platform, format, and hashtag performance
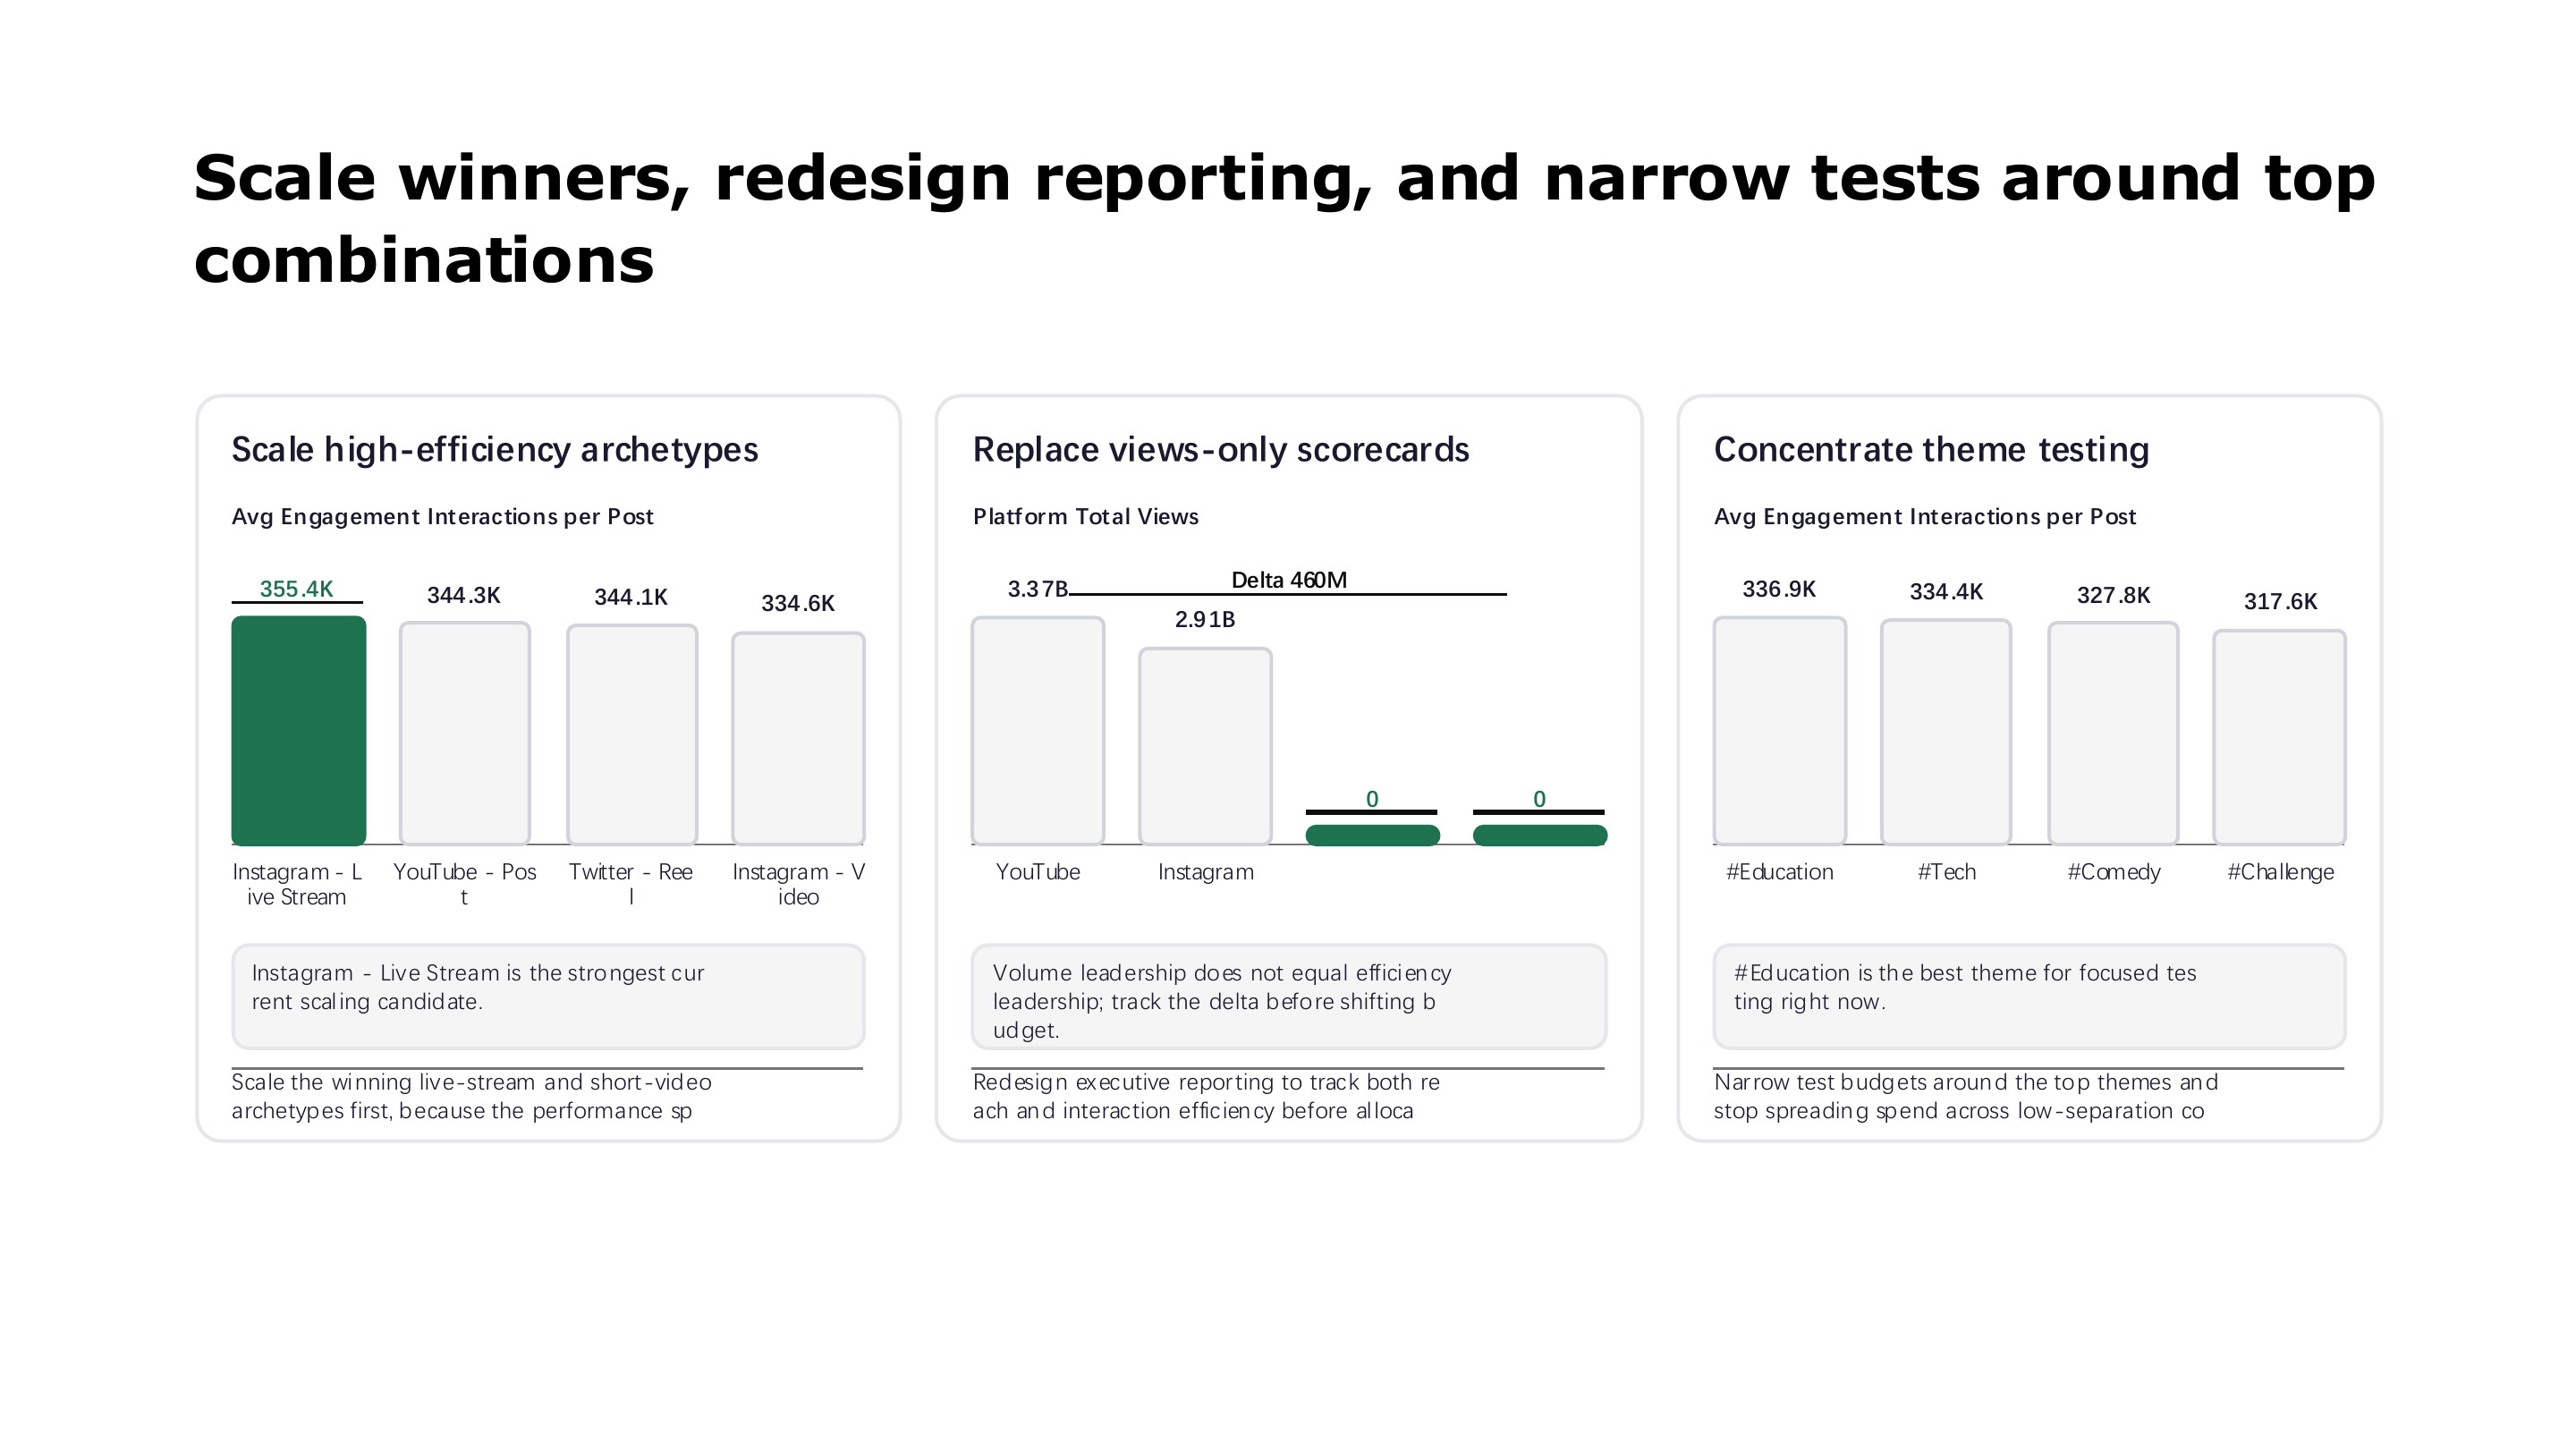
Content allocation recommendations and testing priorities — page 13 of 16
Content allocation recommendations and testing priorities
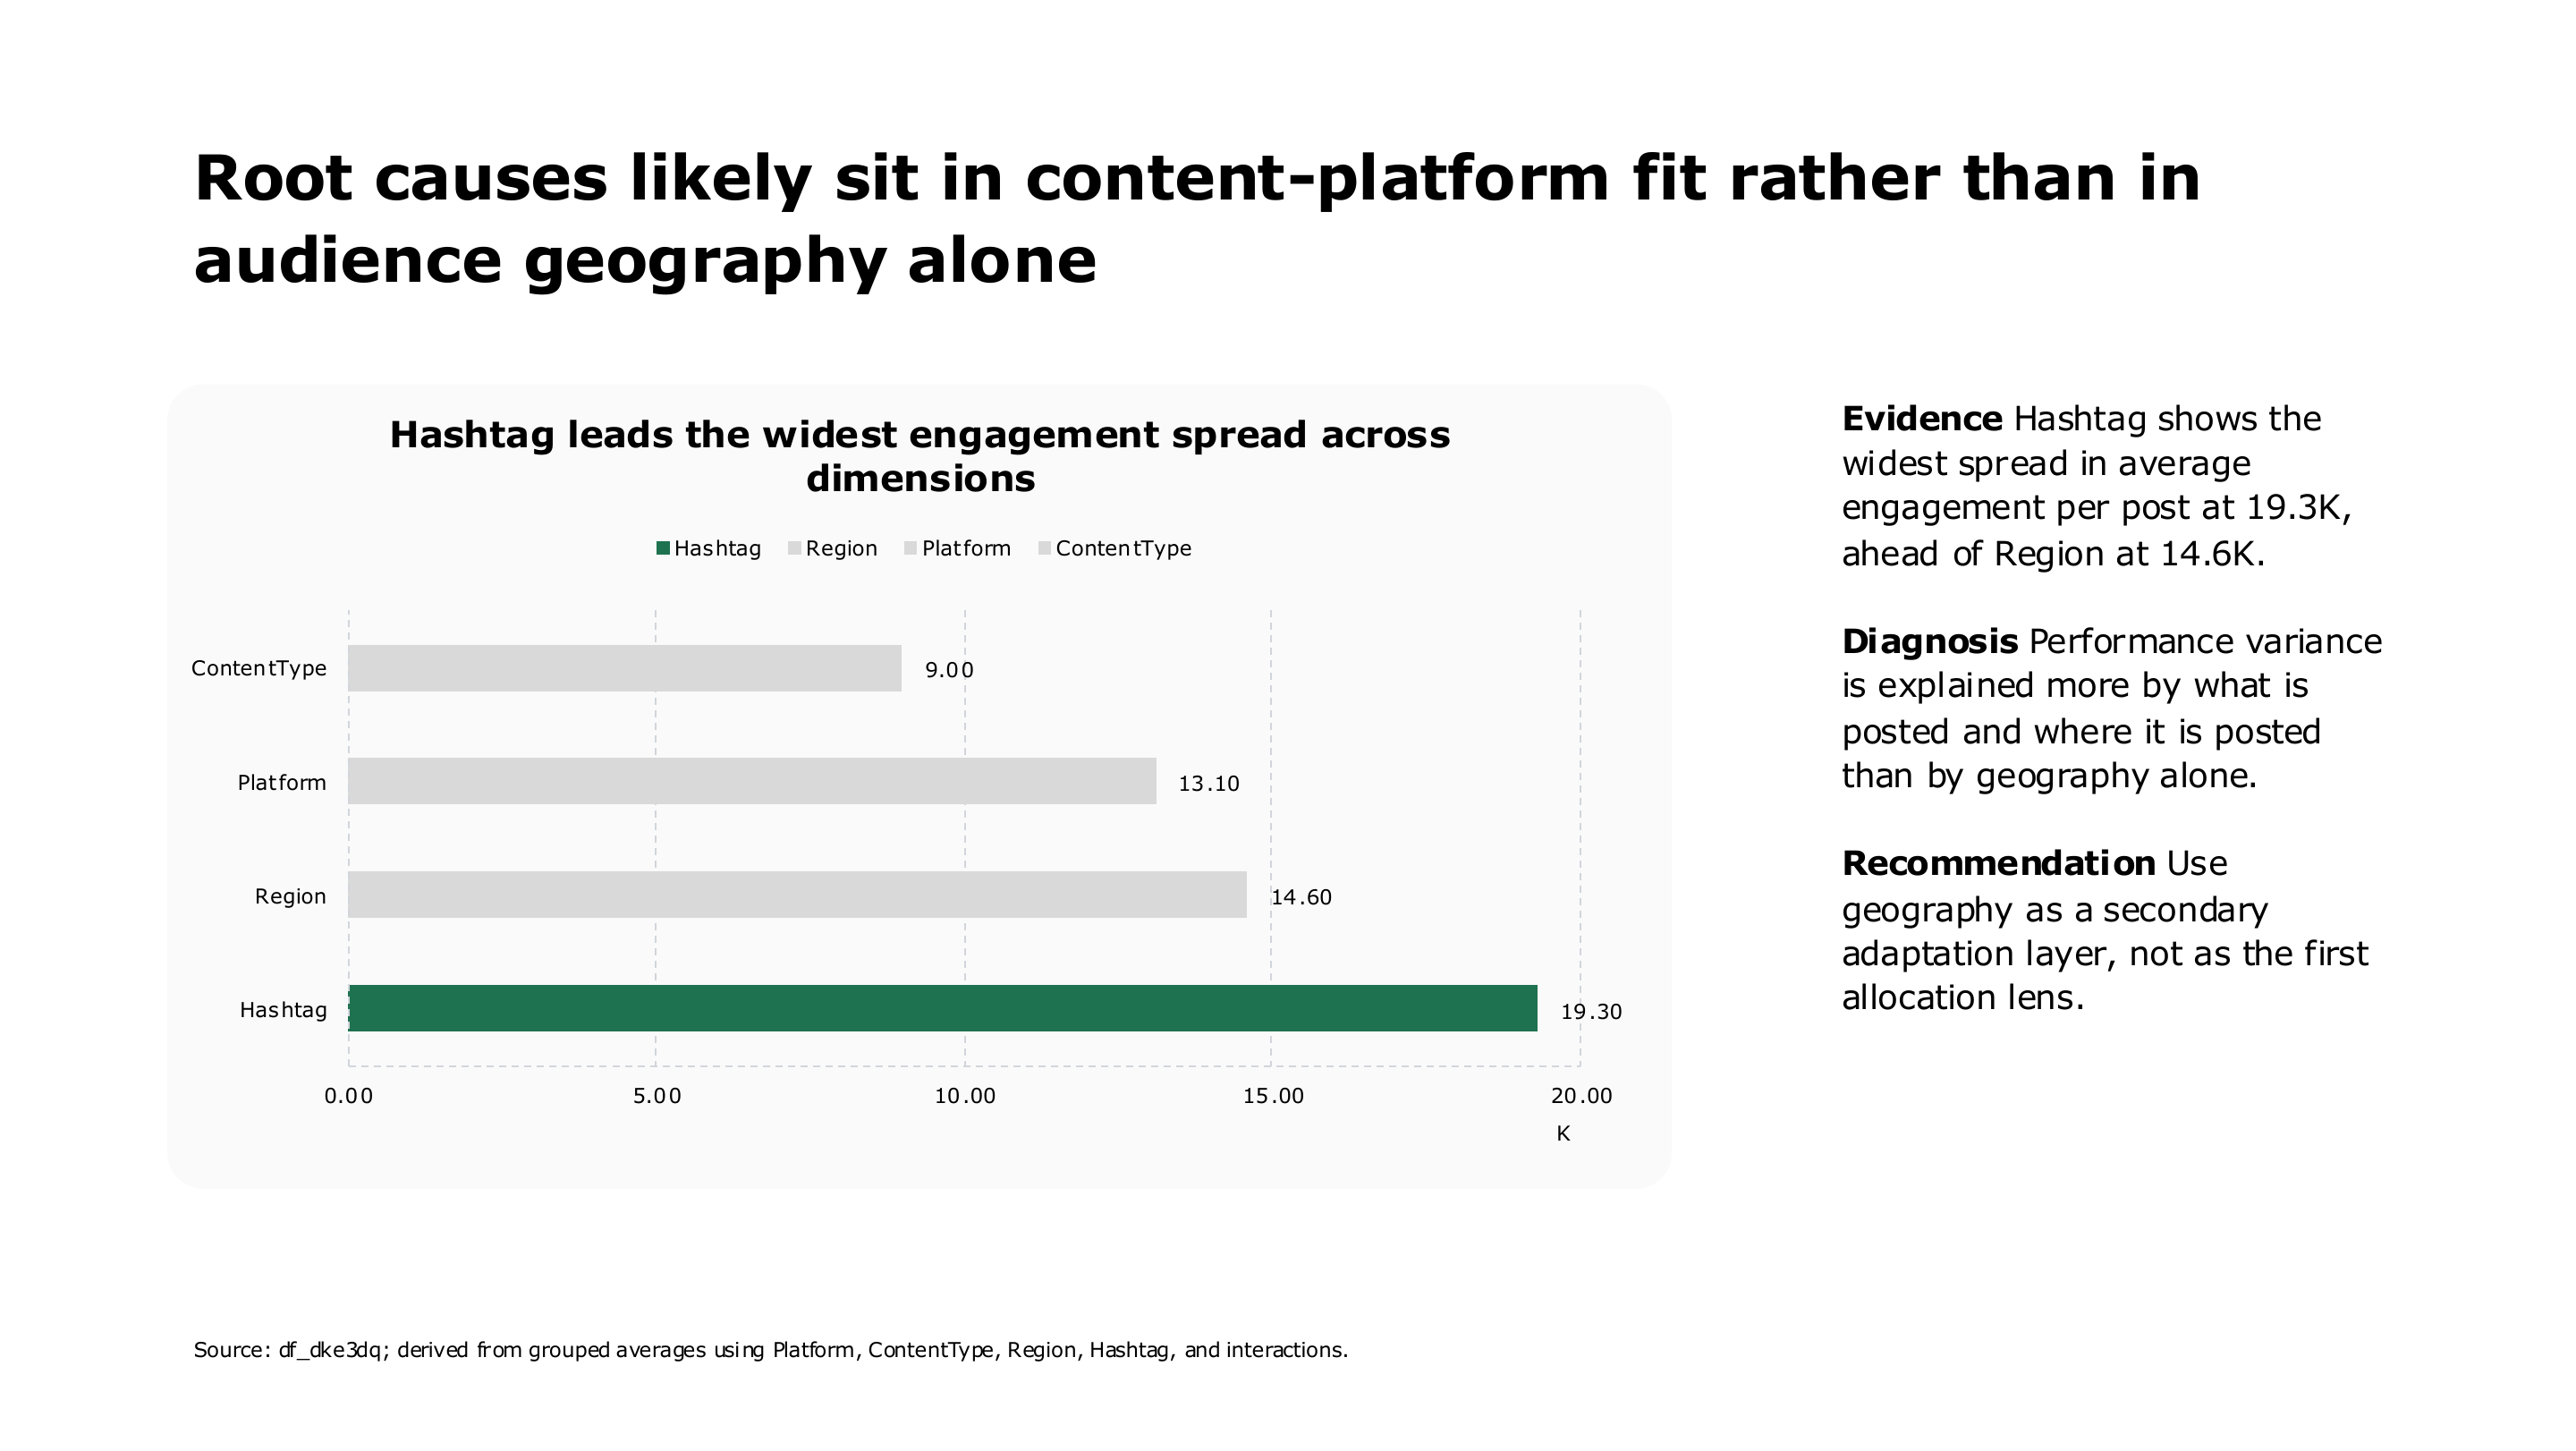
Social media performance root cause analysis — page 14 of 16
Social media performance root cause analysis
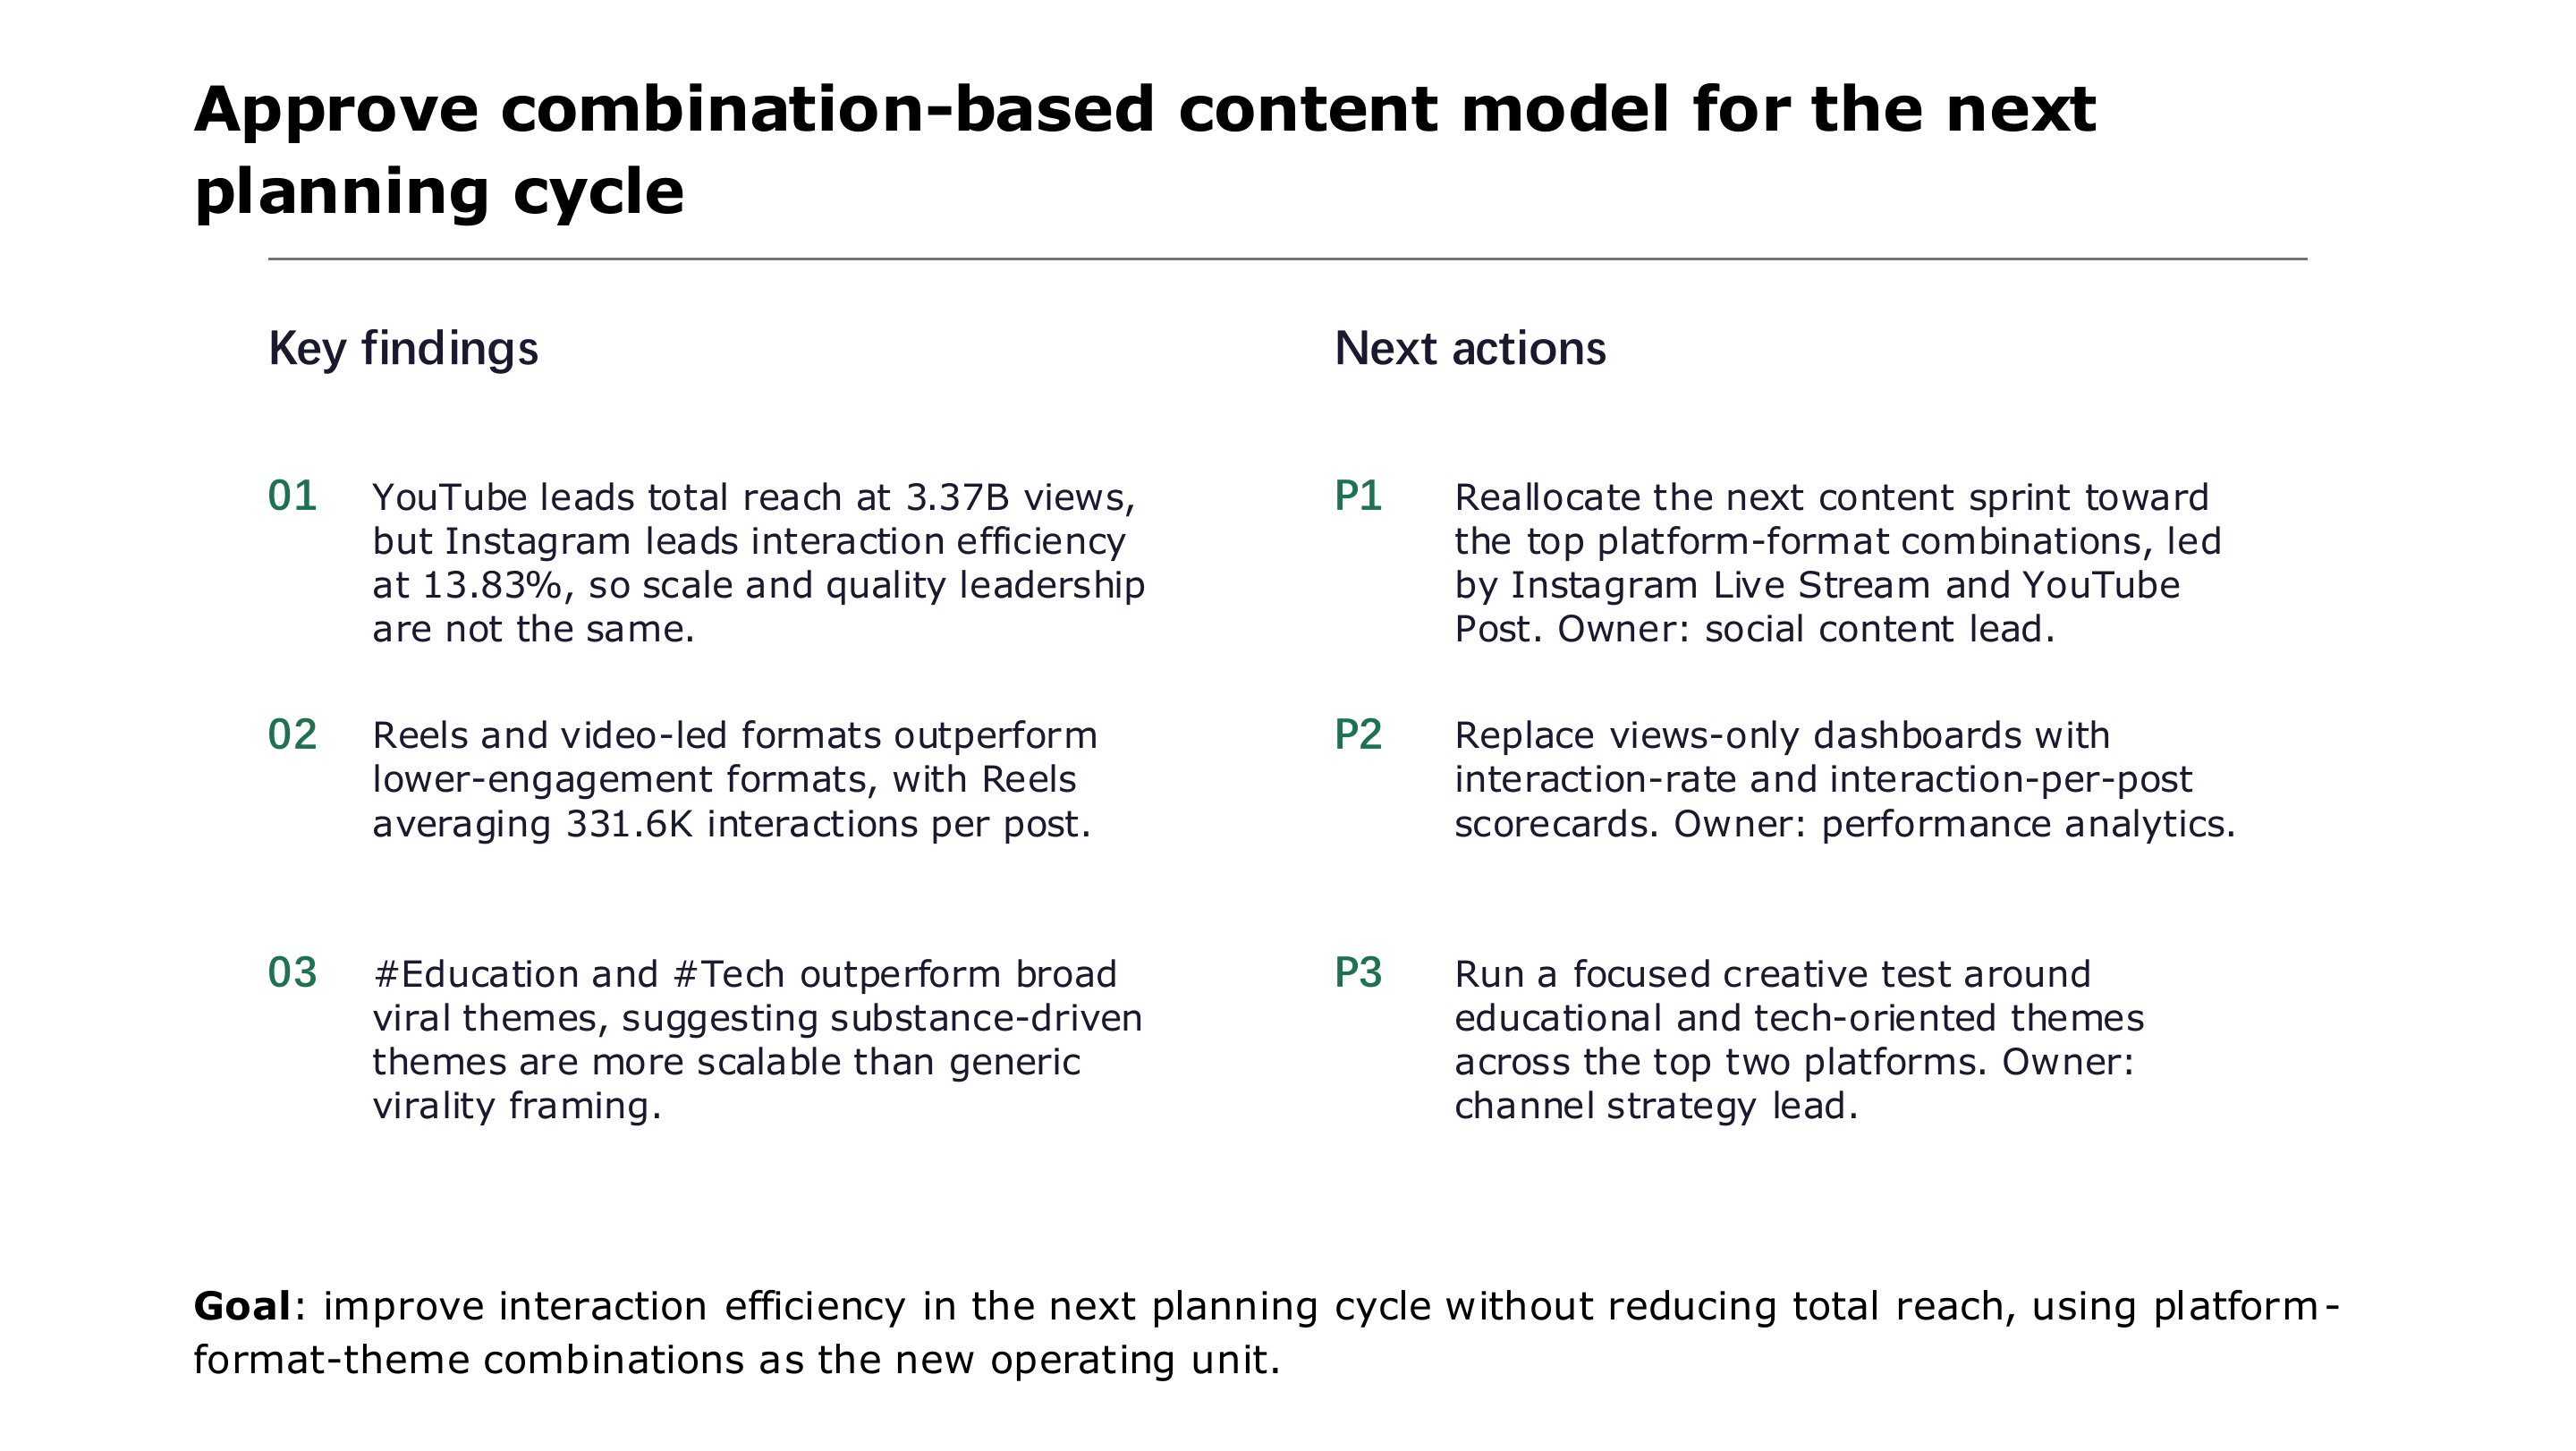
Combination-based content model key findings and next actions — page 15 of 16
Combination-based content model key findings and next actions
Viral Social Media Performance Review closing page — page 16 of 16
Viral Social Media Performance Review closing page
01 / 16

Da planilha à apresentação

Apresentações de dados com IA

Transforme Excel ou CSV em apresentações com gráficos, resumos executivos, insights e recomendações.

Excel e CSVApresentaçõesRecomendações

Mais formas de analisar

Comece com o que você já tem.

Transforme uma imagem, uma pergunta ou uma planilha em uma resposta clara sem refazer o fluxo.
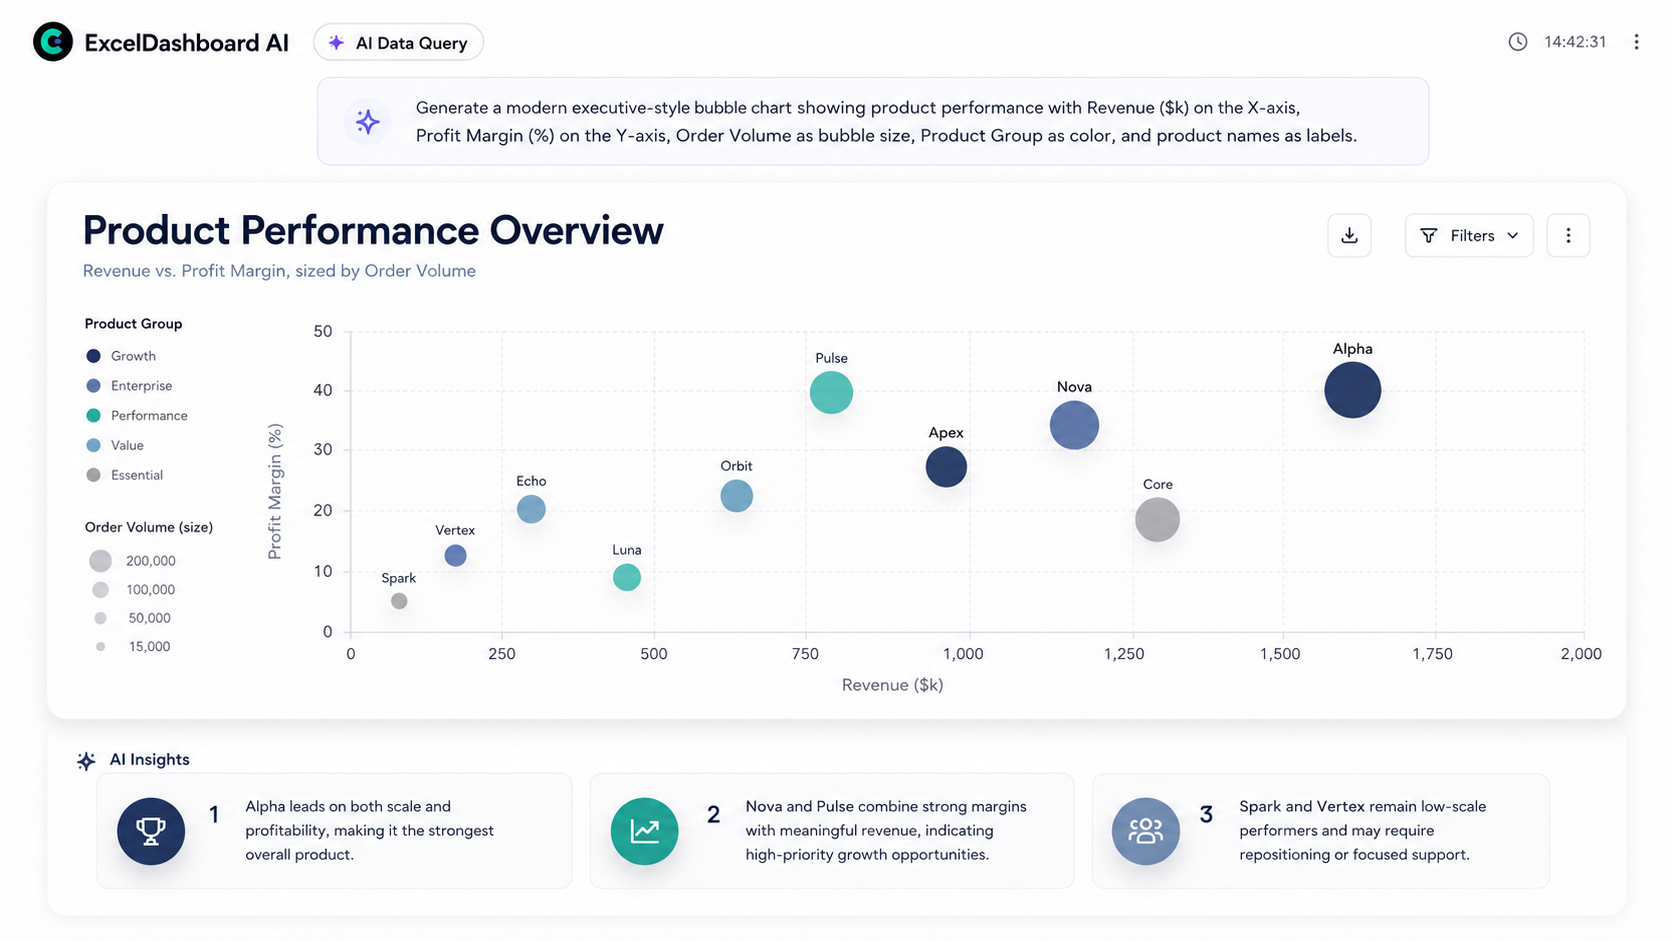
ExcelDashboard AI
A spreadsheet data question answered with charts and analysis in ExcelDashboard AI
Respostas sem fórmulas ou SQLResposta gerada com seus dados