자동 보고 소프트웨어고객에게 전달할 수 있는 결과물을 위해.

다음을 위한 솔루션

Excel, CSV, 텍스트, 이미지와 웹 리서치를 고객용 보고서, 대시보드, 편집 가능한 PowerPoint·Word·Excel 파일로 전환하세요.

전 세계 300,000명 이상의 사용자가 신뢰합니다

MCP & SKILLS

Connect MCP. Deliver reports in your Agent.

ExcelDashboard AI provides an MCP server and a report Skill. Your Agent analyzes and verifies data, then creates visual reports, tracks progress, and gets live previews. First connection requires user sign-in and workspace selection.

Connection information for Agents

Production MCP endpoint

https://api.exceldashboard.ai/mcp

Streamable HTTP · OAuth · create_report / get_report

Agents: read https://www.exceldashboard.ai/mcp.md for the complete English Skill, outline format, and client setup. Reading documentation does not configure MCP or complete OAuth.

Setup instruction for your Agent

Read https://www.exceldashboard.ai/mcp.md, including the full report Skill and outline reference. Use this client's supported workflow to configure ExcelDashboard AI MCP at https://api.exceldashboard.ai/mcp with Streamable HTTP. Guide me through browser OAuth and workspace selection. Install the report Skill from https://smithery.ai/skills/exceldashboard-ai/exceldashboard-report if supported; otherwise follow its complete instructions in this conversation. Verify the current session discovers create_report and get_report. Do not create a report. If this client cannot configure a custom MCP connection, explain that limitation and give its supported setup steps; do not claim a connection from reading the website.

하나의 AI 워크스페이스

데이터를 답으로 바꾸는 세 가지 방법.

데이터를 업로드하거나 질문으로 시작하세요. AI가 최종 결과물까지 완성합니다.

Viral Social Media Performance Review

Swipe through all 16 pages of this AI-generated social media performance data report.
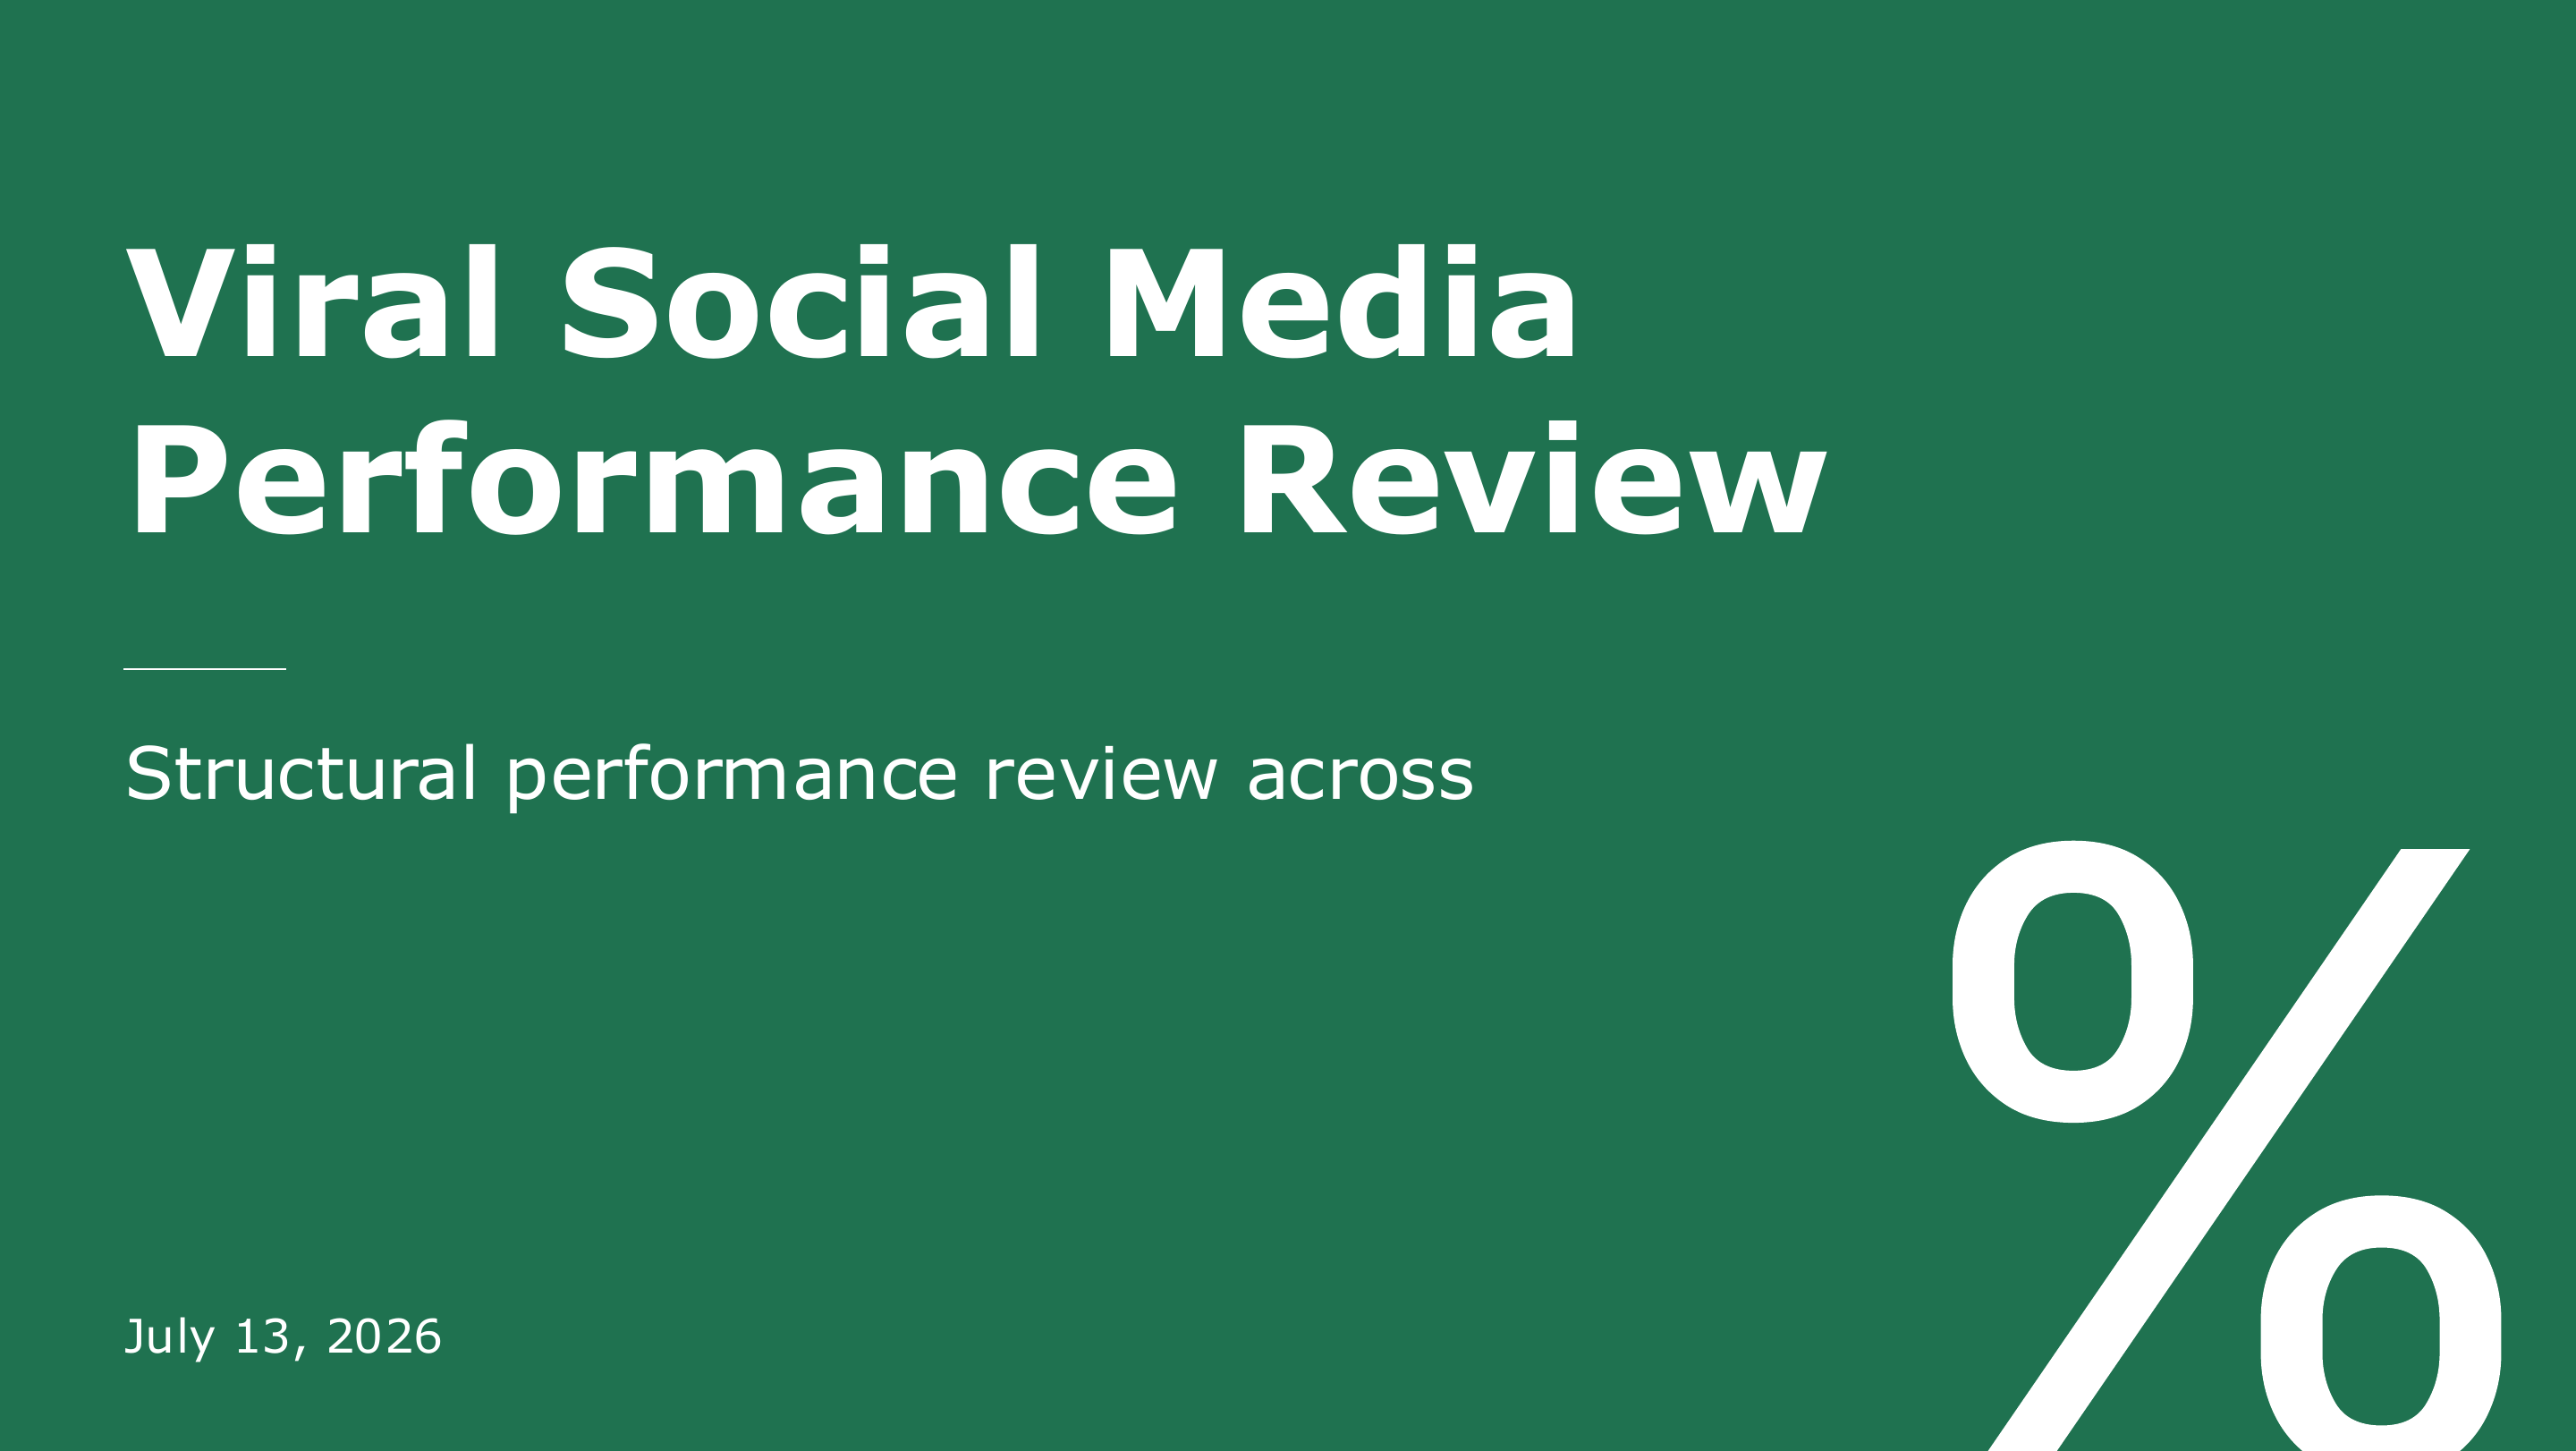
Viral Social Media Performance Review cover — page 1 of 16
Viral Social Media Performance Review cover
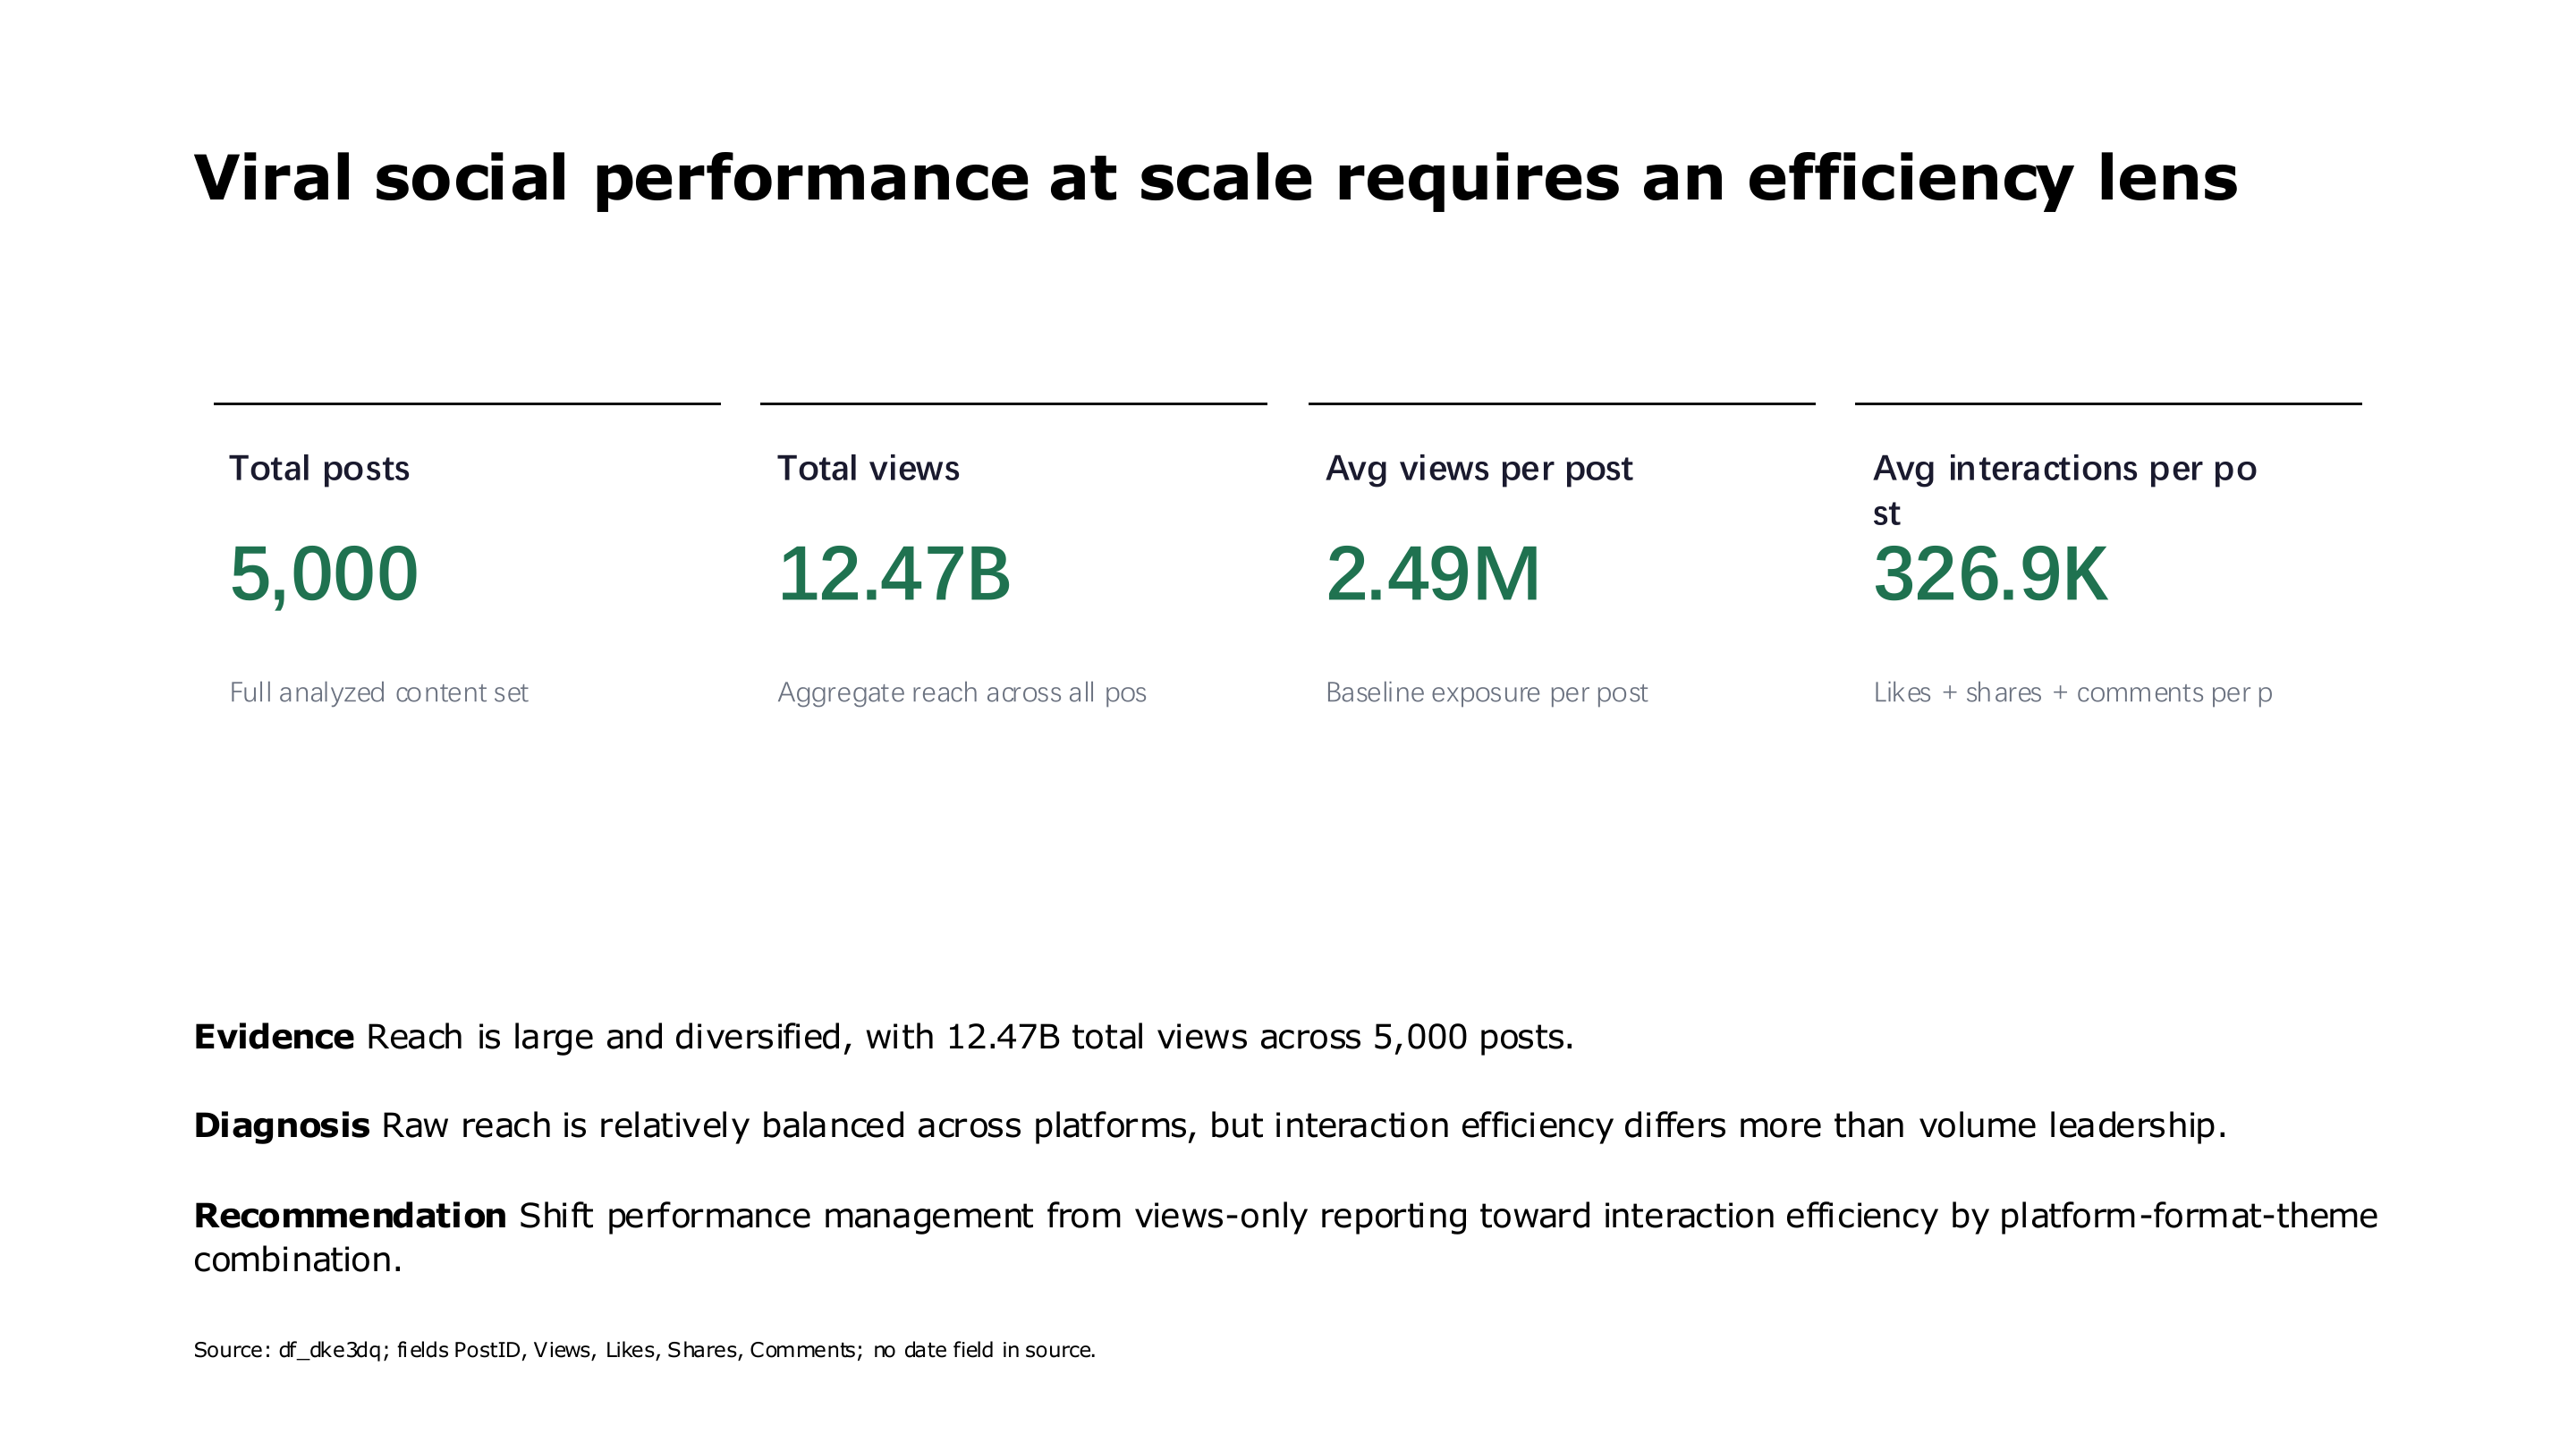
Viral social media performance at scale executive summary — page 2 of 16
Viral social media performance at scale executive summary
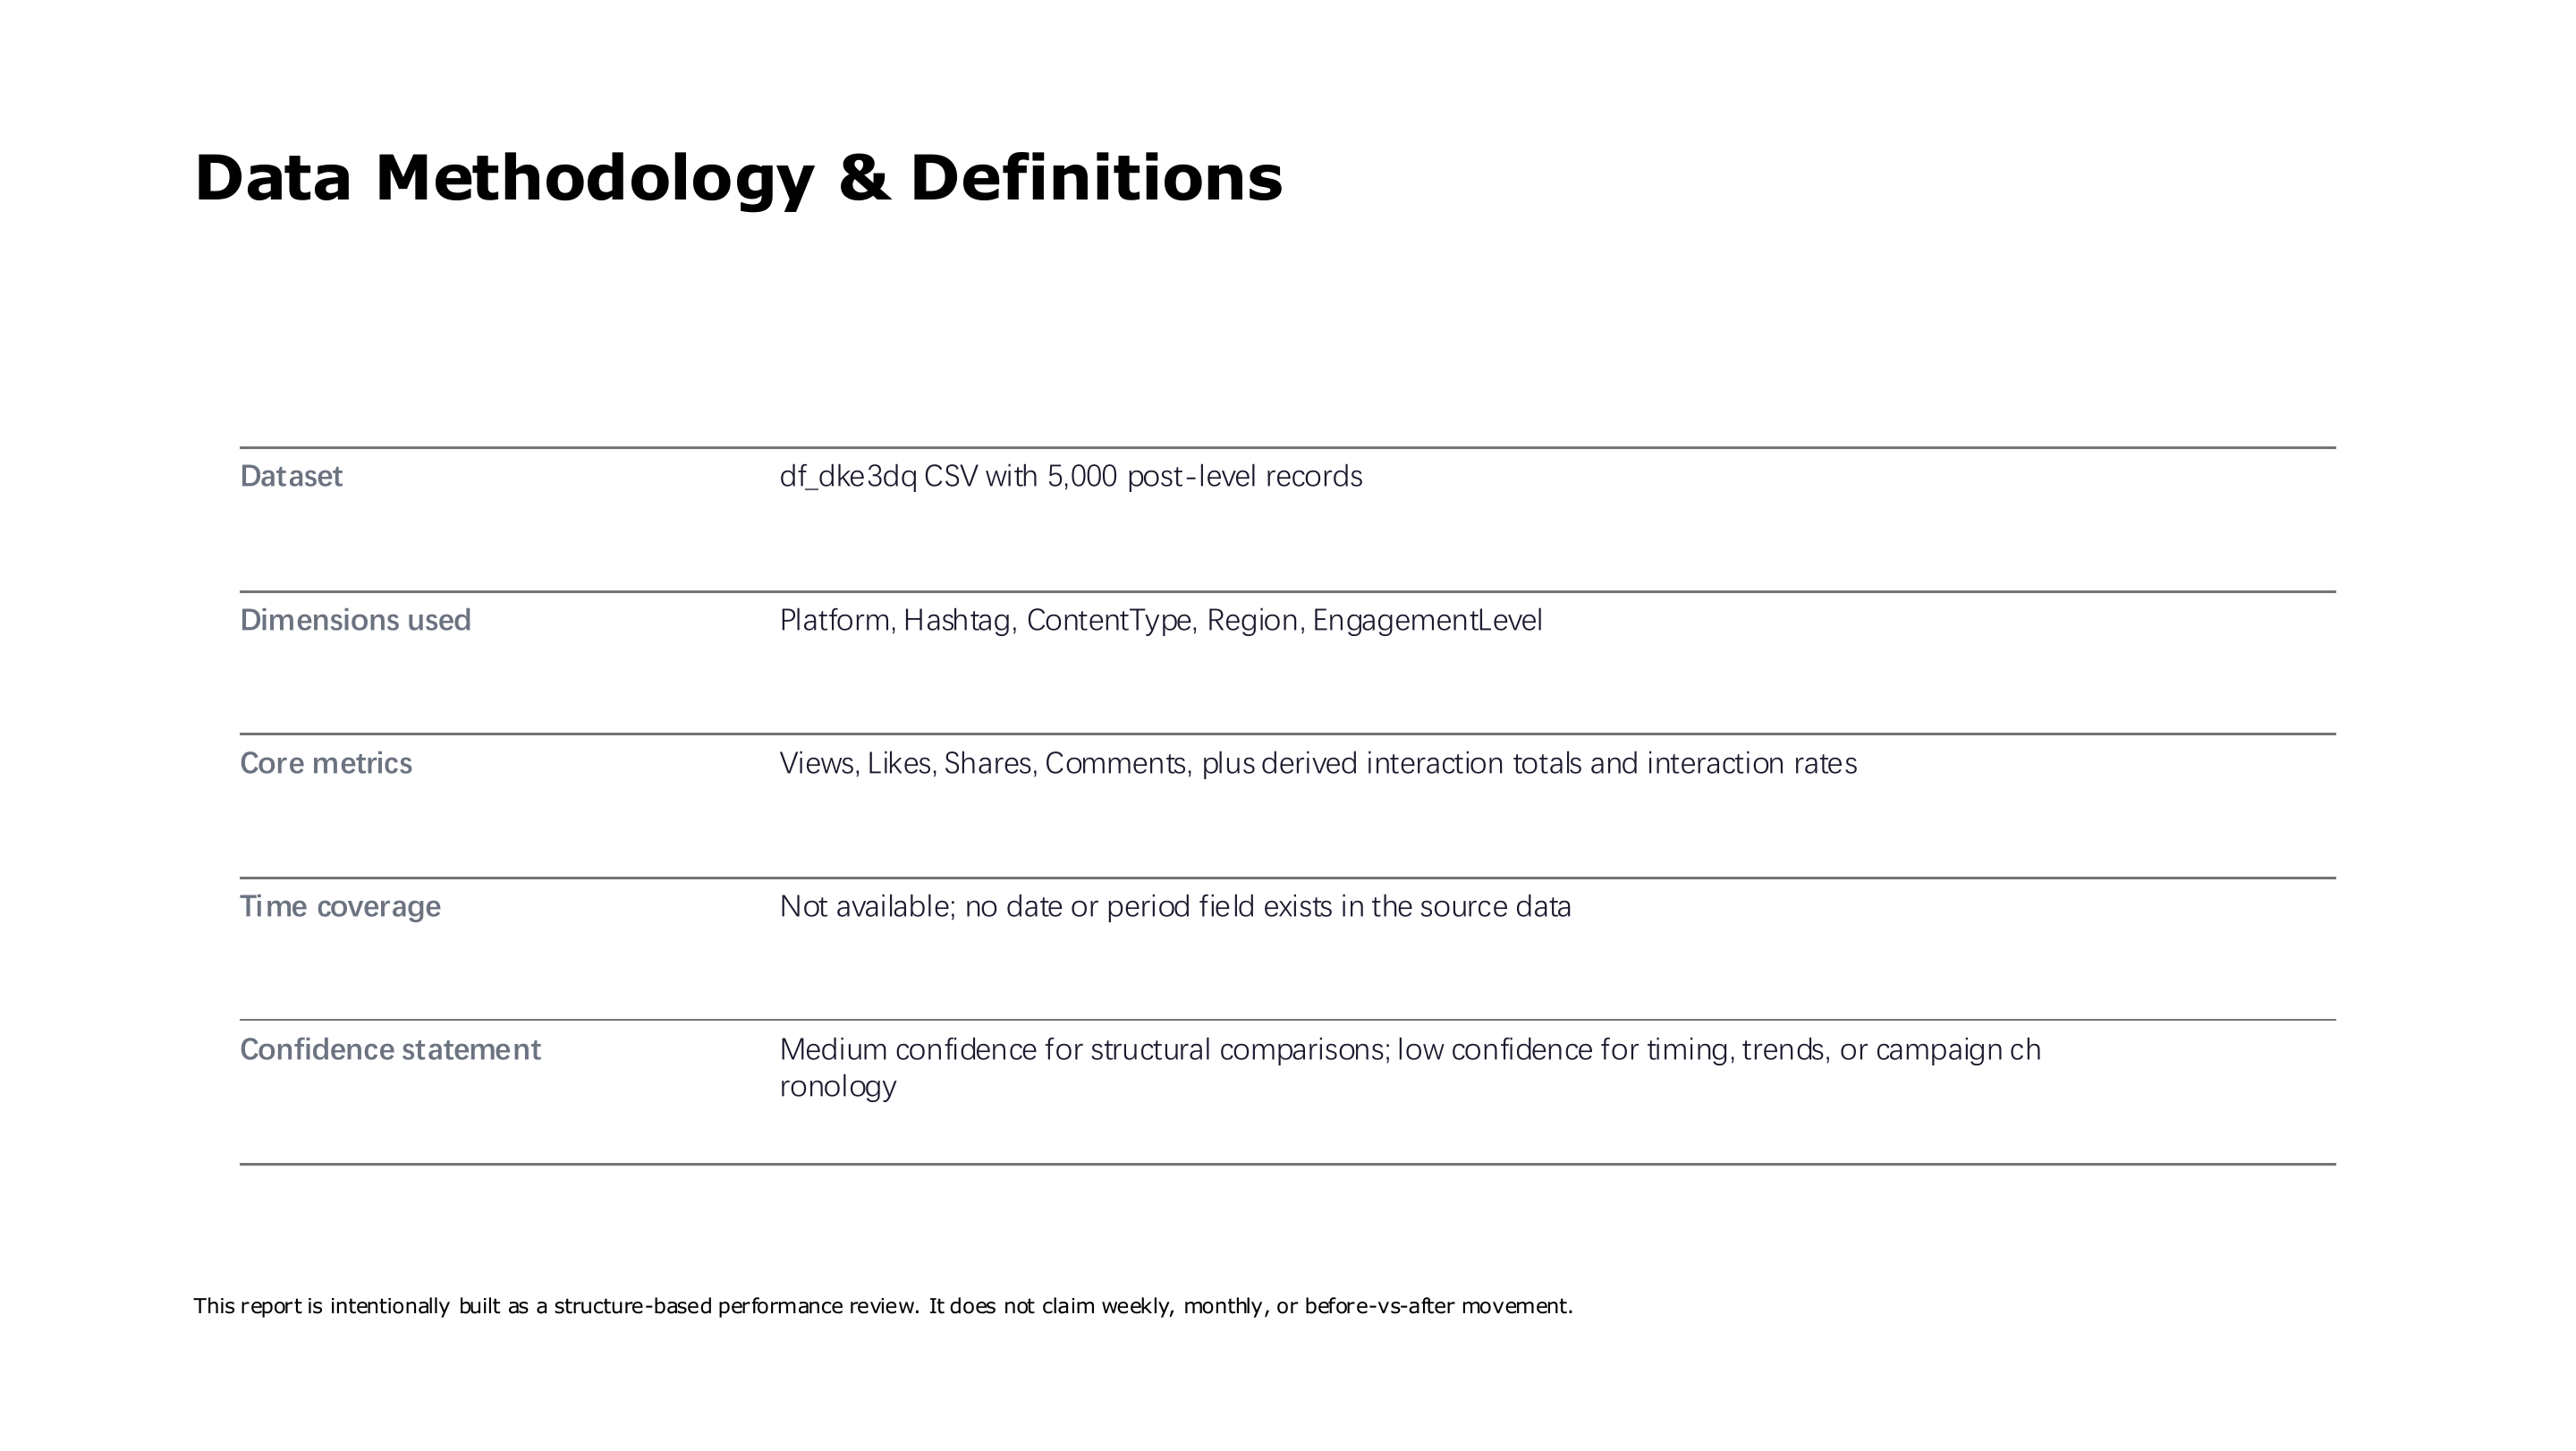
Social media data methodology and metric definitions — page 3 of 16
Social media data methodology and metric definitions
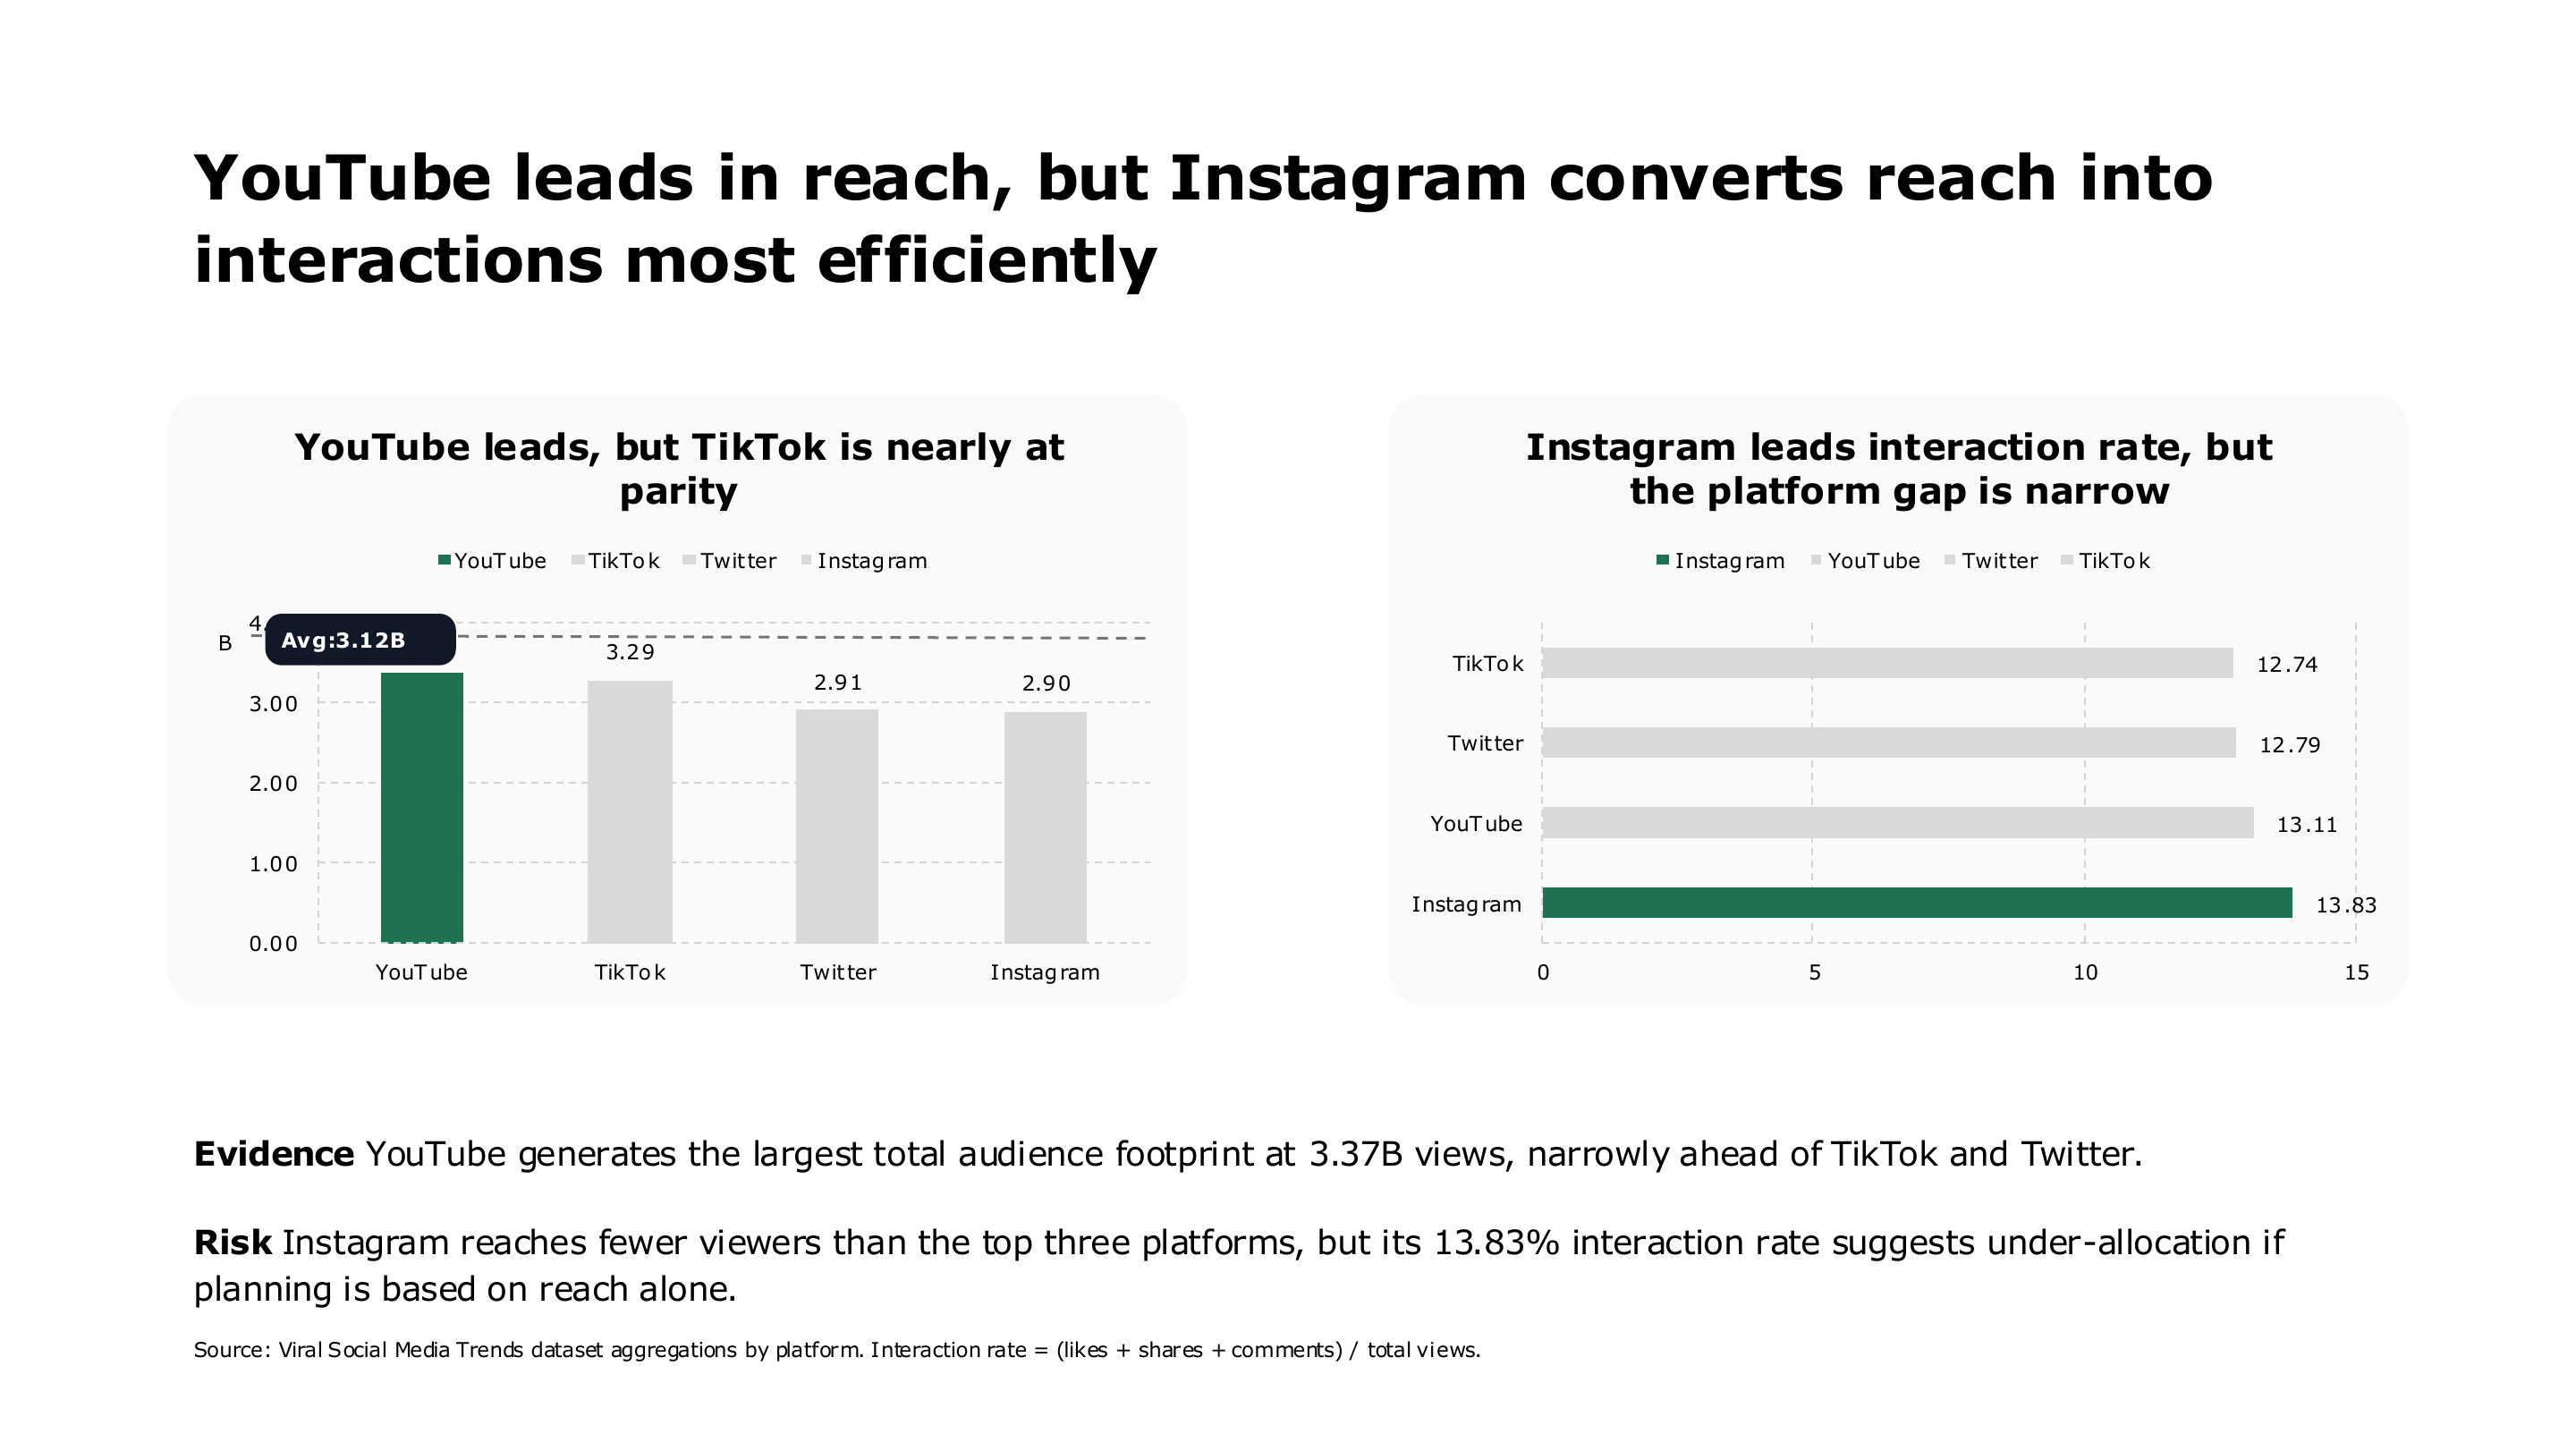
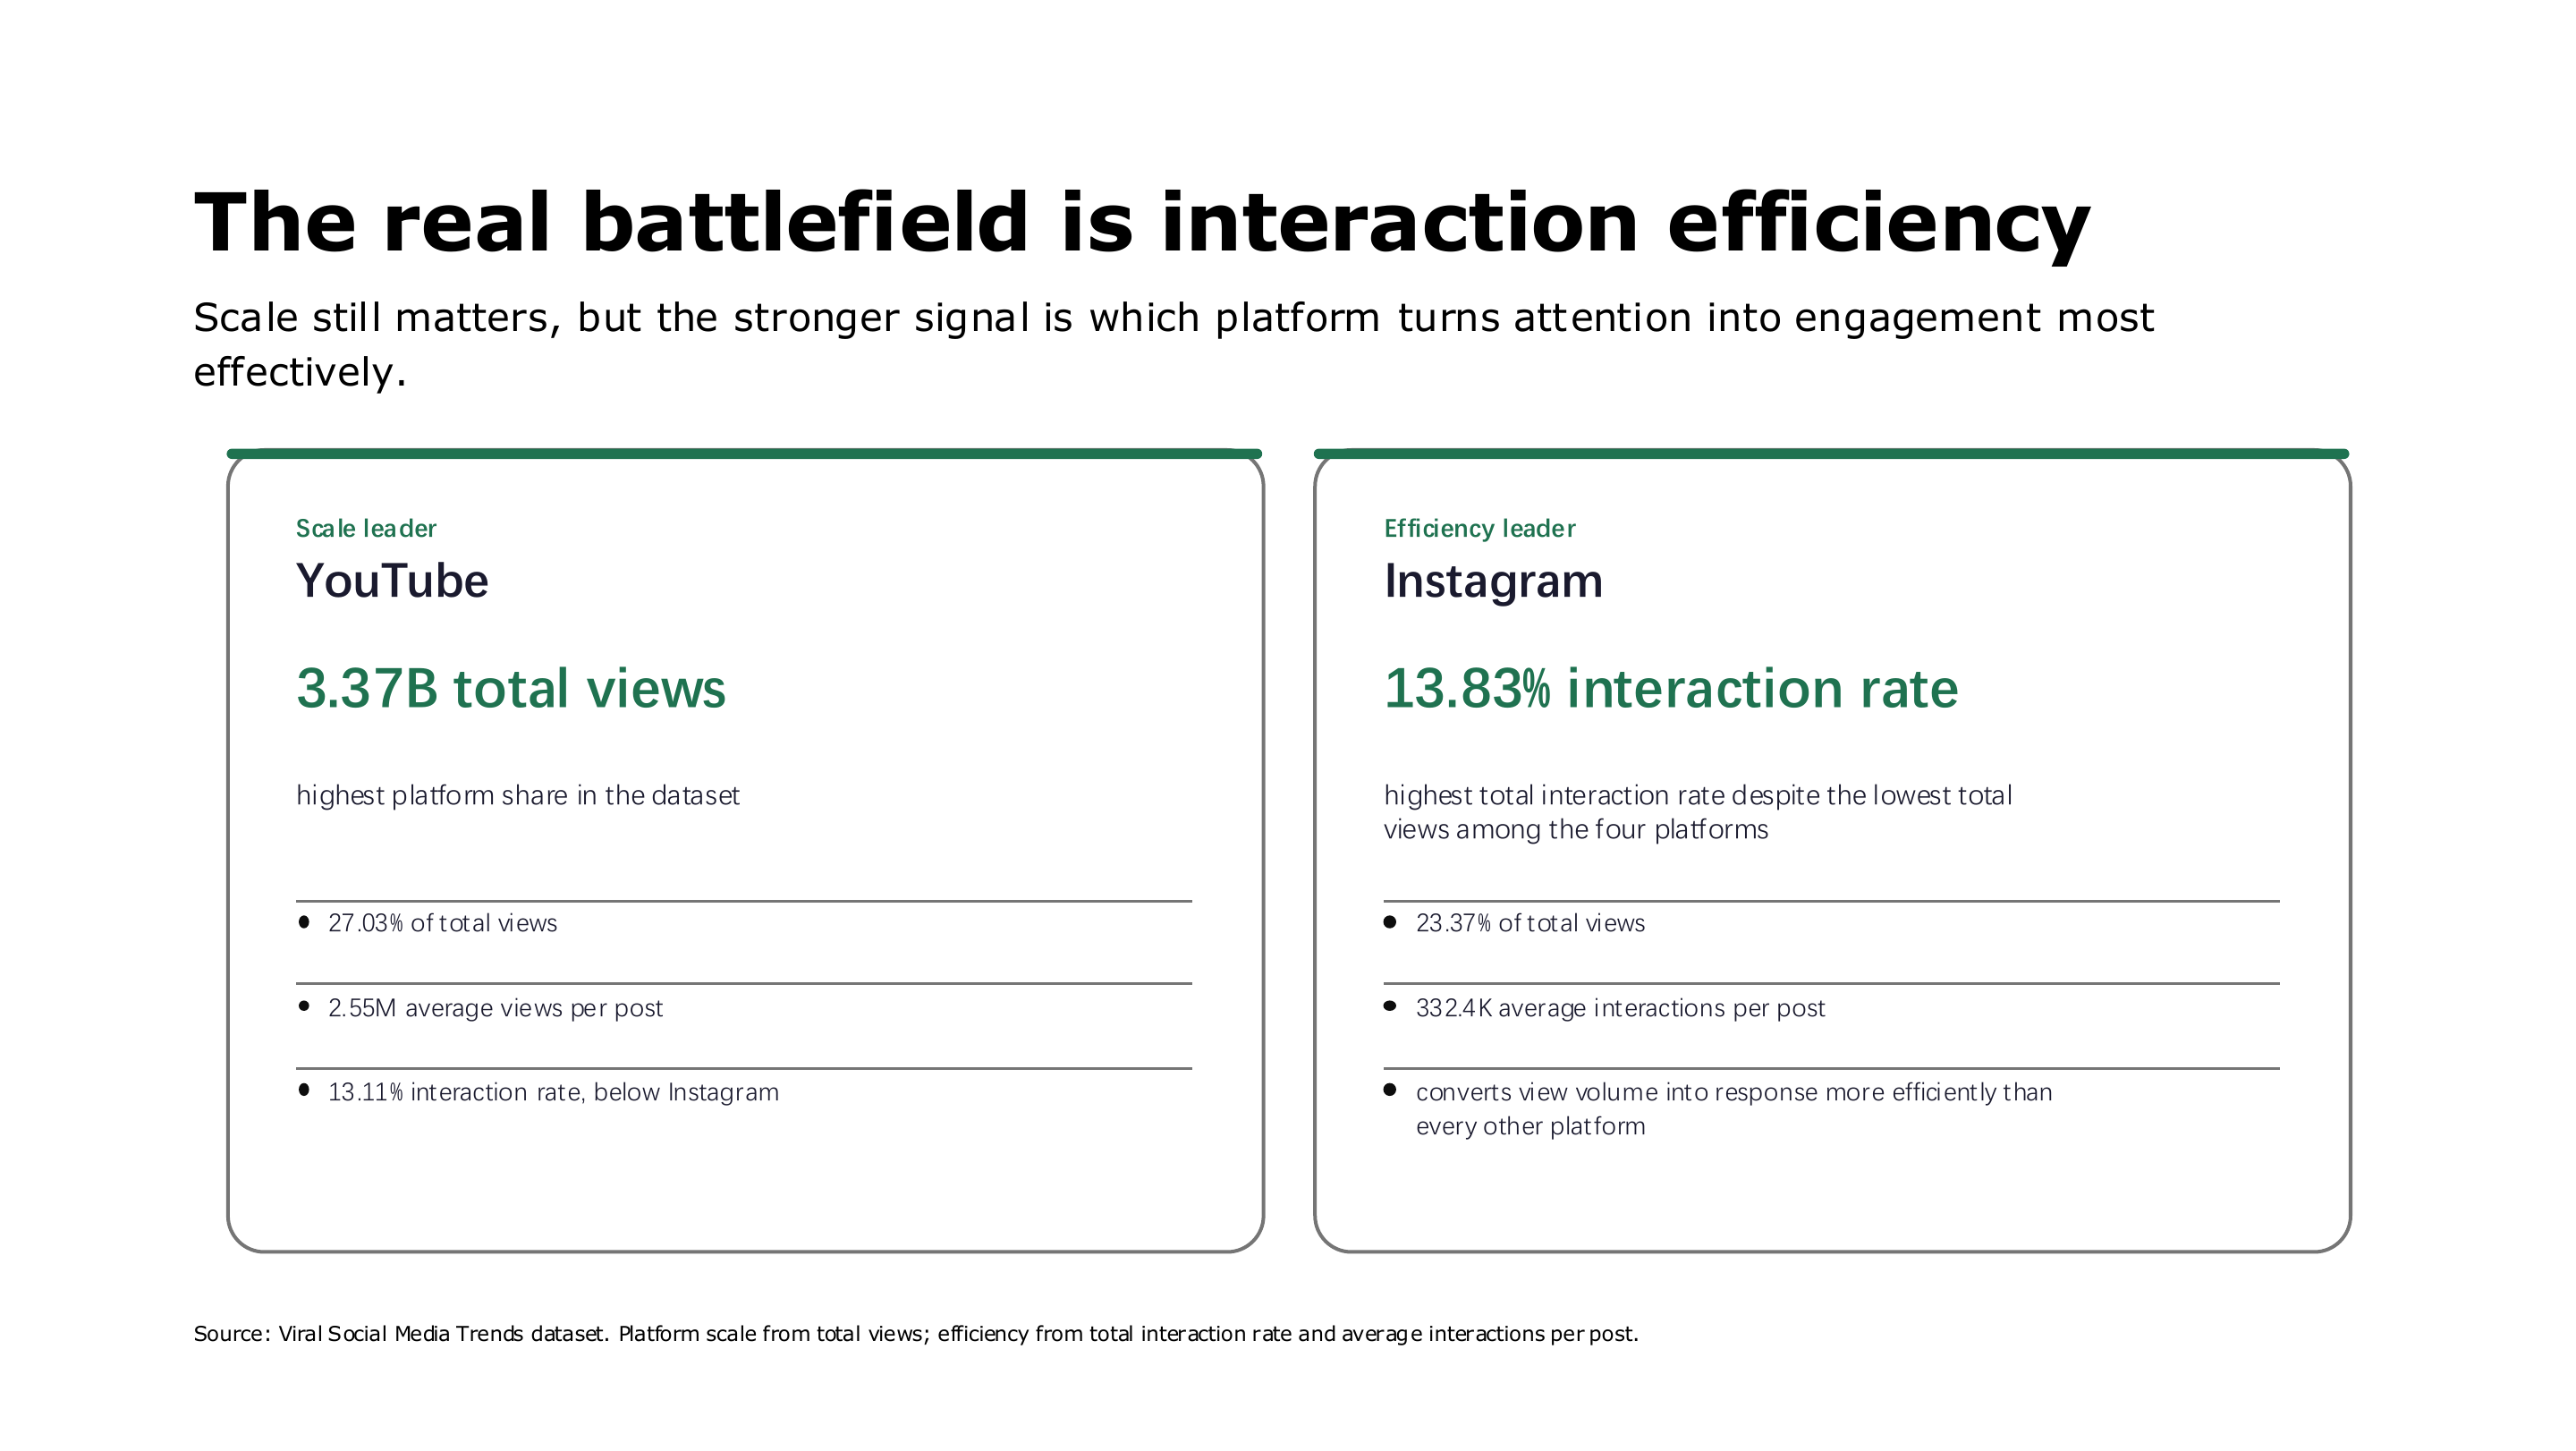
YouTube reach and Instagram interaction efficiency comparison — page 4 of 16
YouTube reach and Instagram interaction efficiency comparison
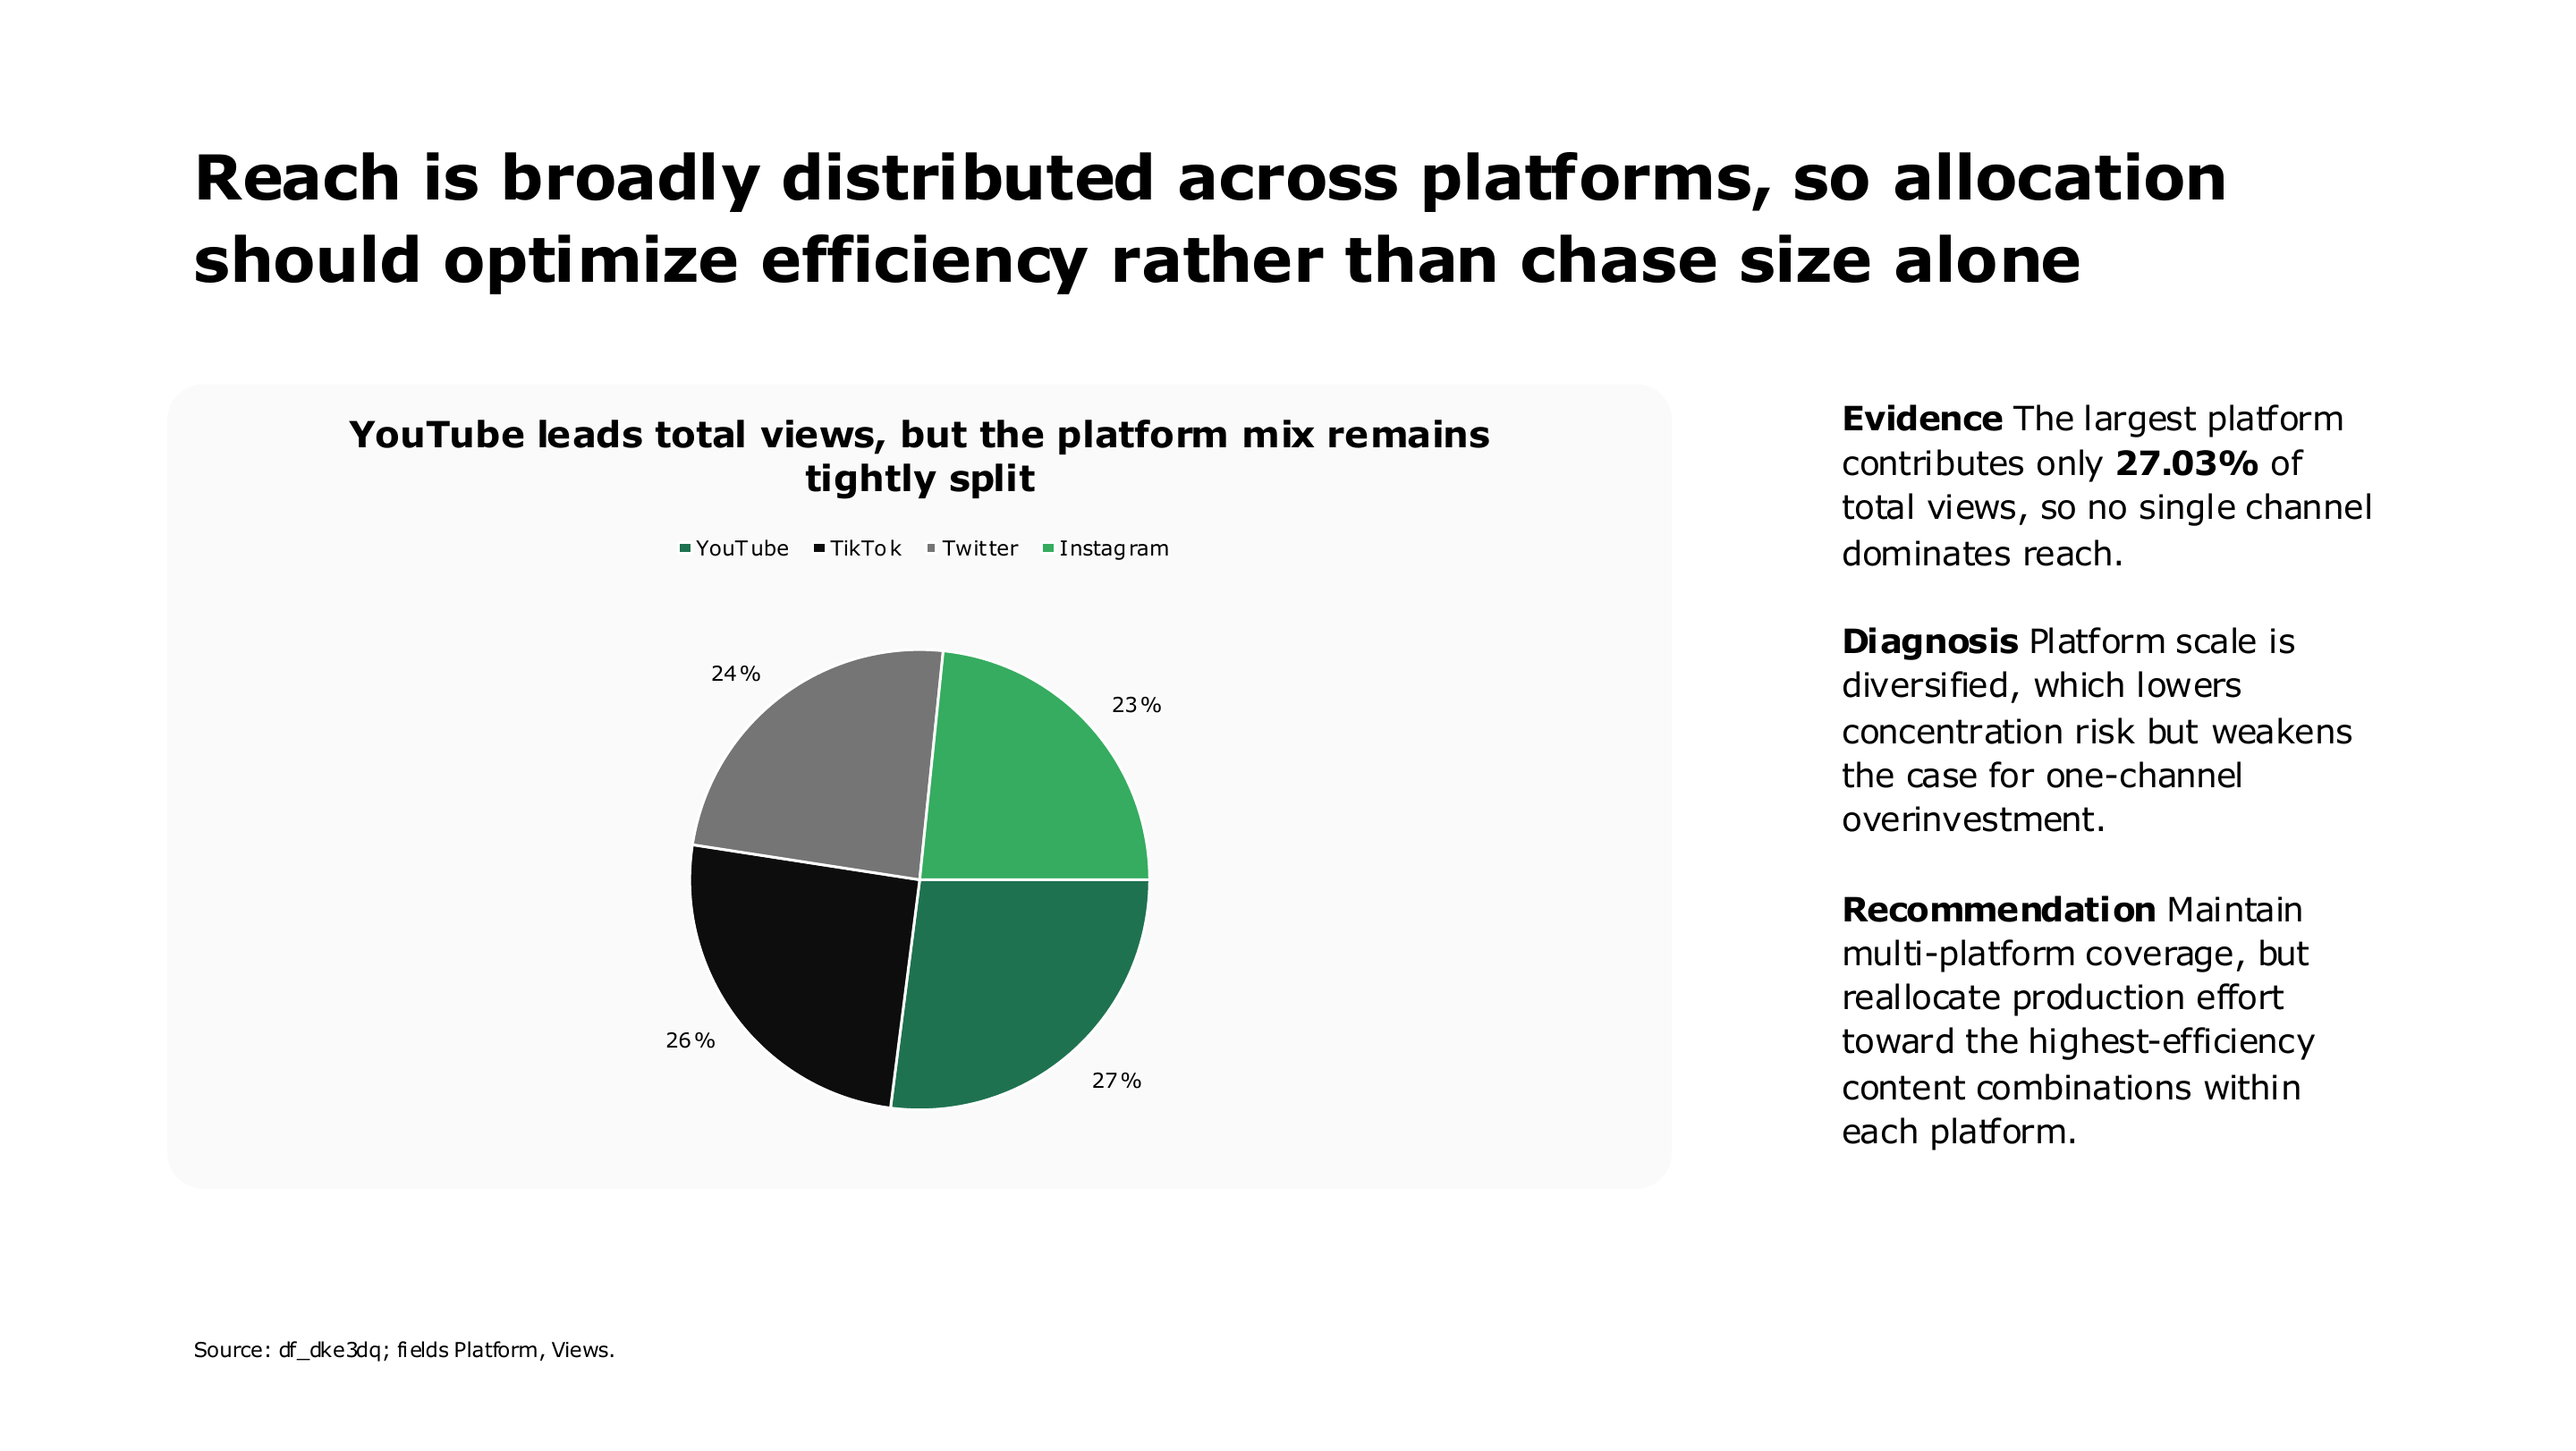
Social media platform reach allocation analysis — page 5 of 16
Social media platform reach allocation analysis
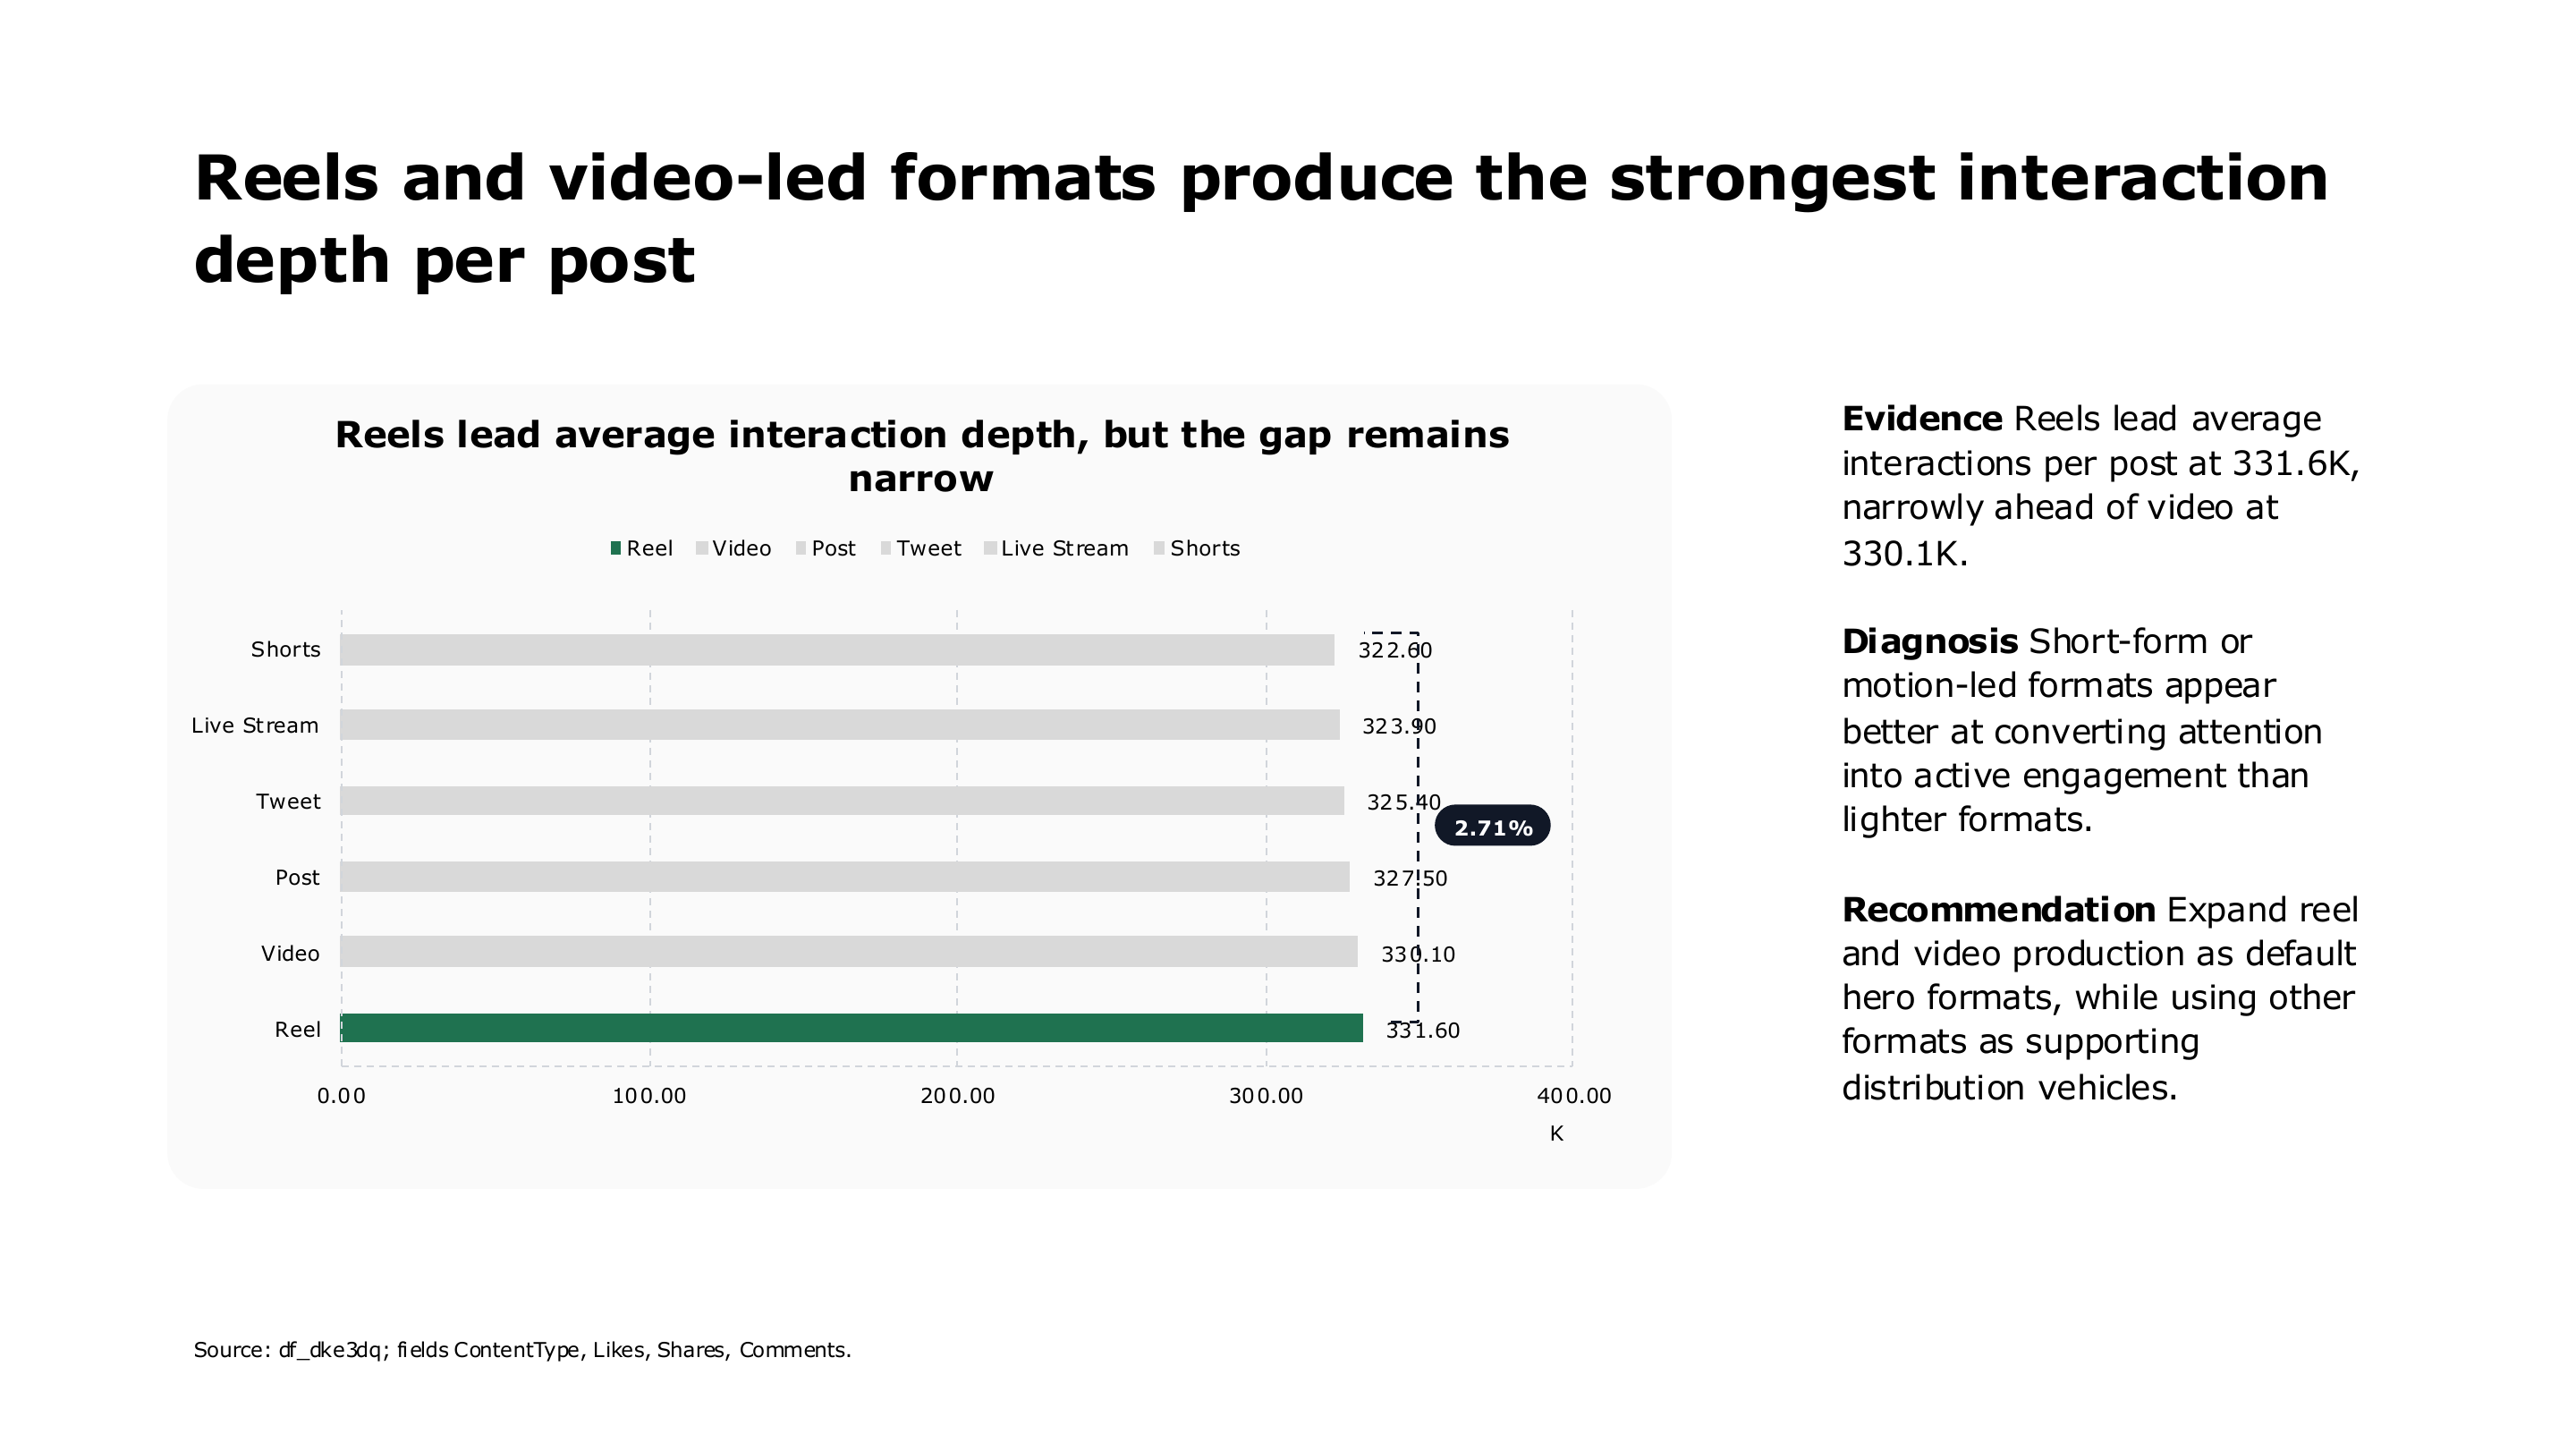
Reels and video format engagement performance — page 6 of 16
Reels and video format engagement performance
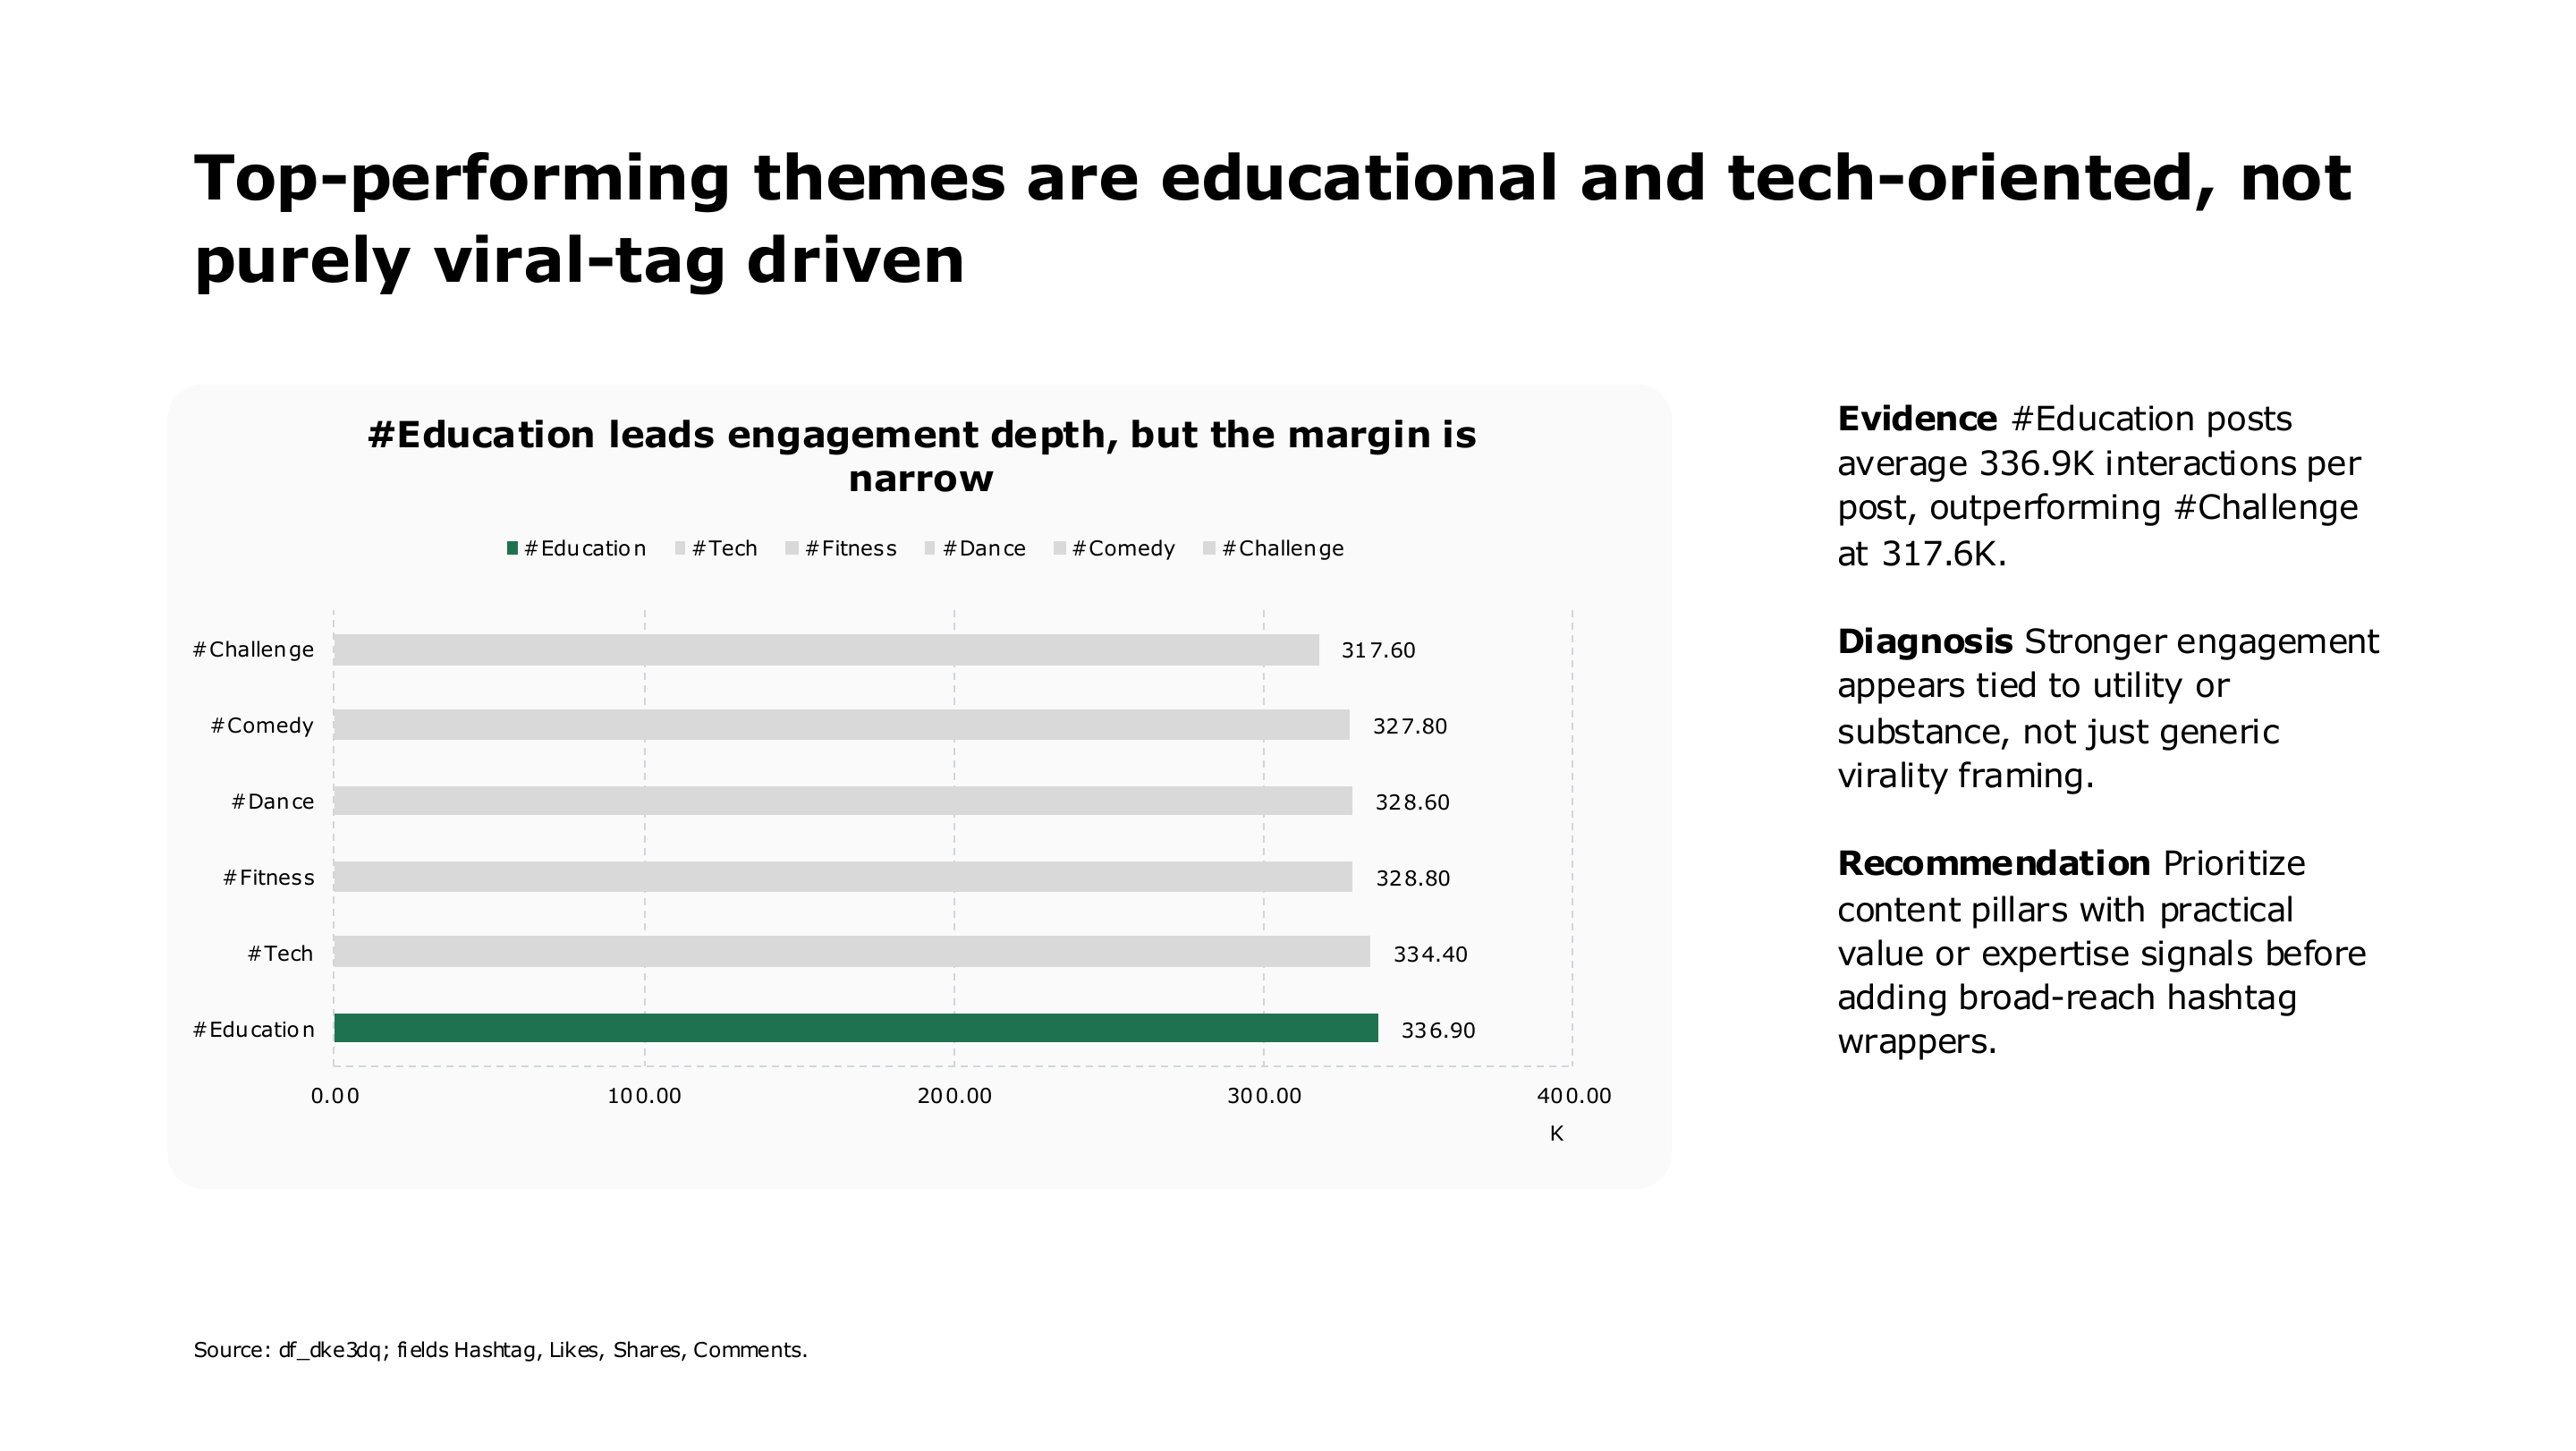
Educational and technology hashtag engagement performance — page 7 of 16
Educational and technology hashtag engagement performance
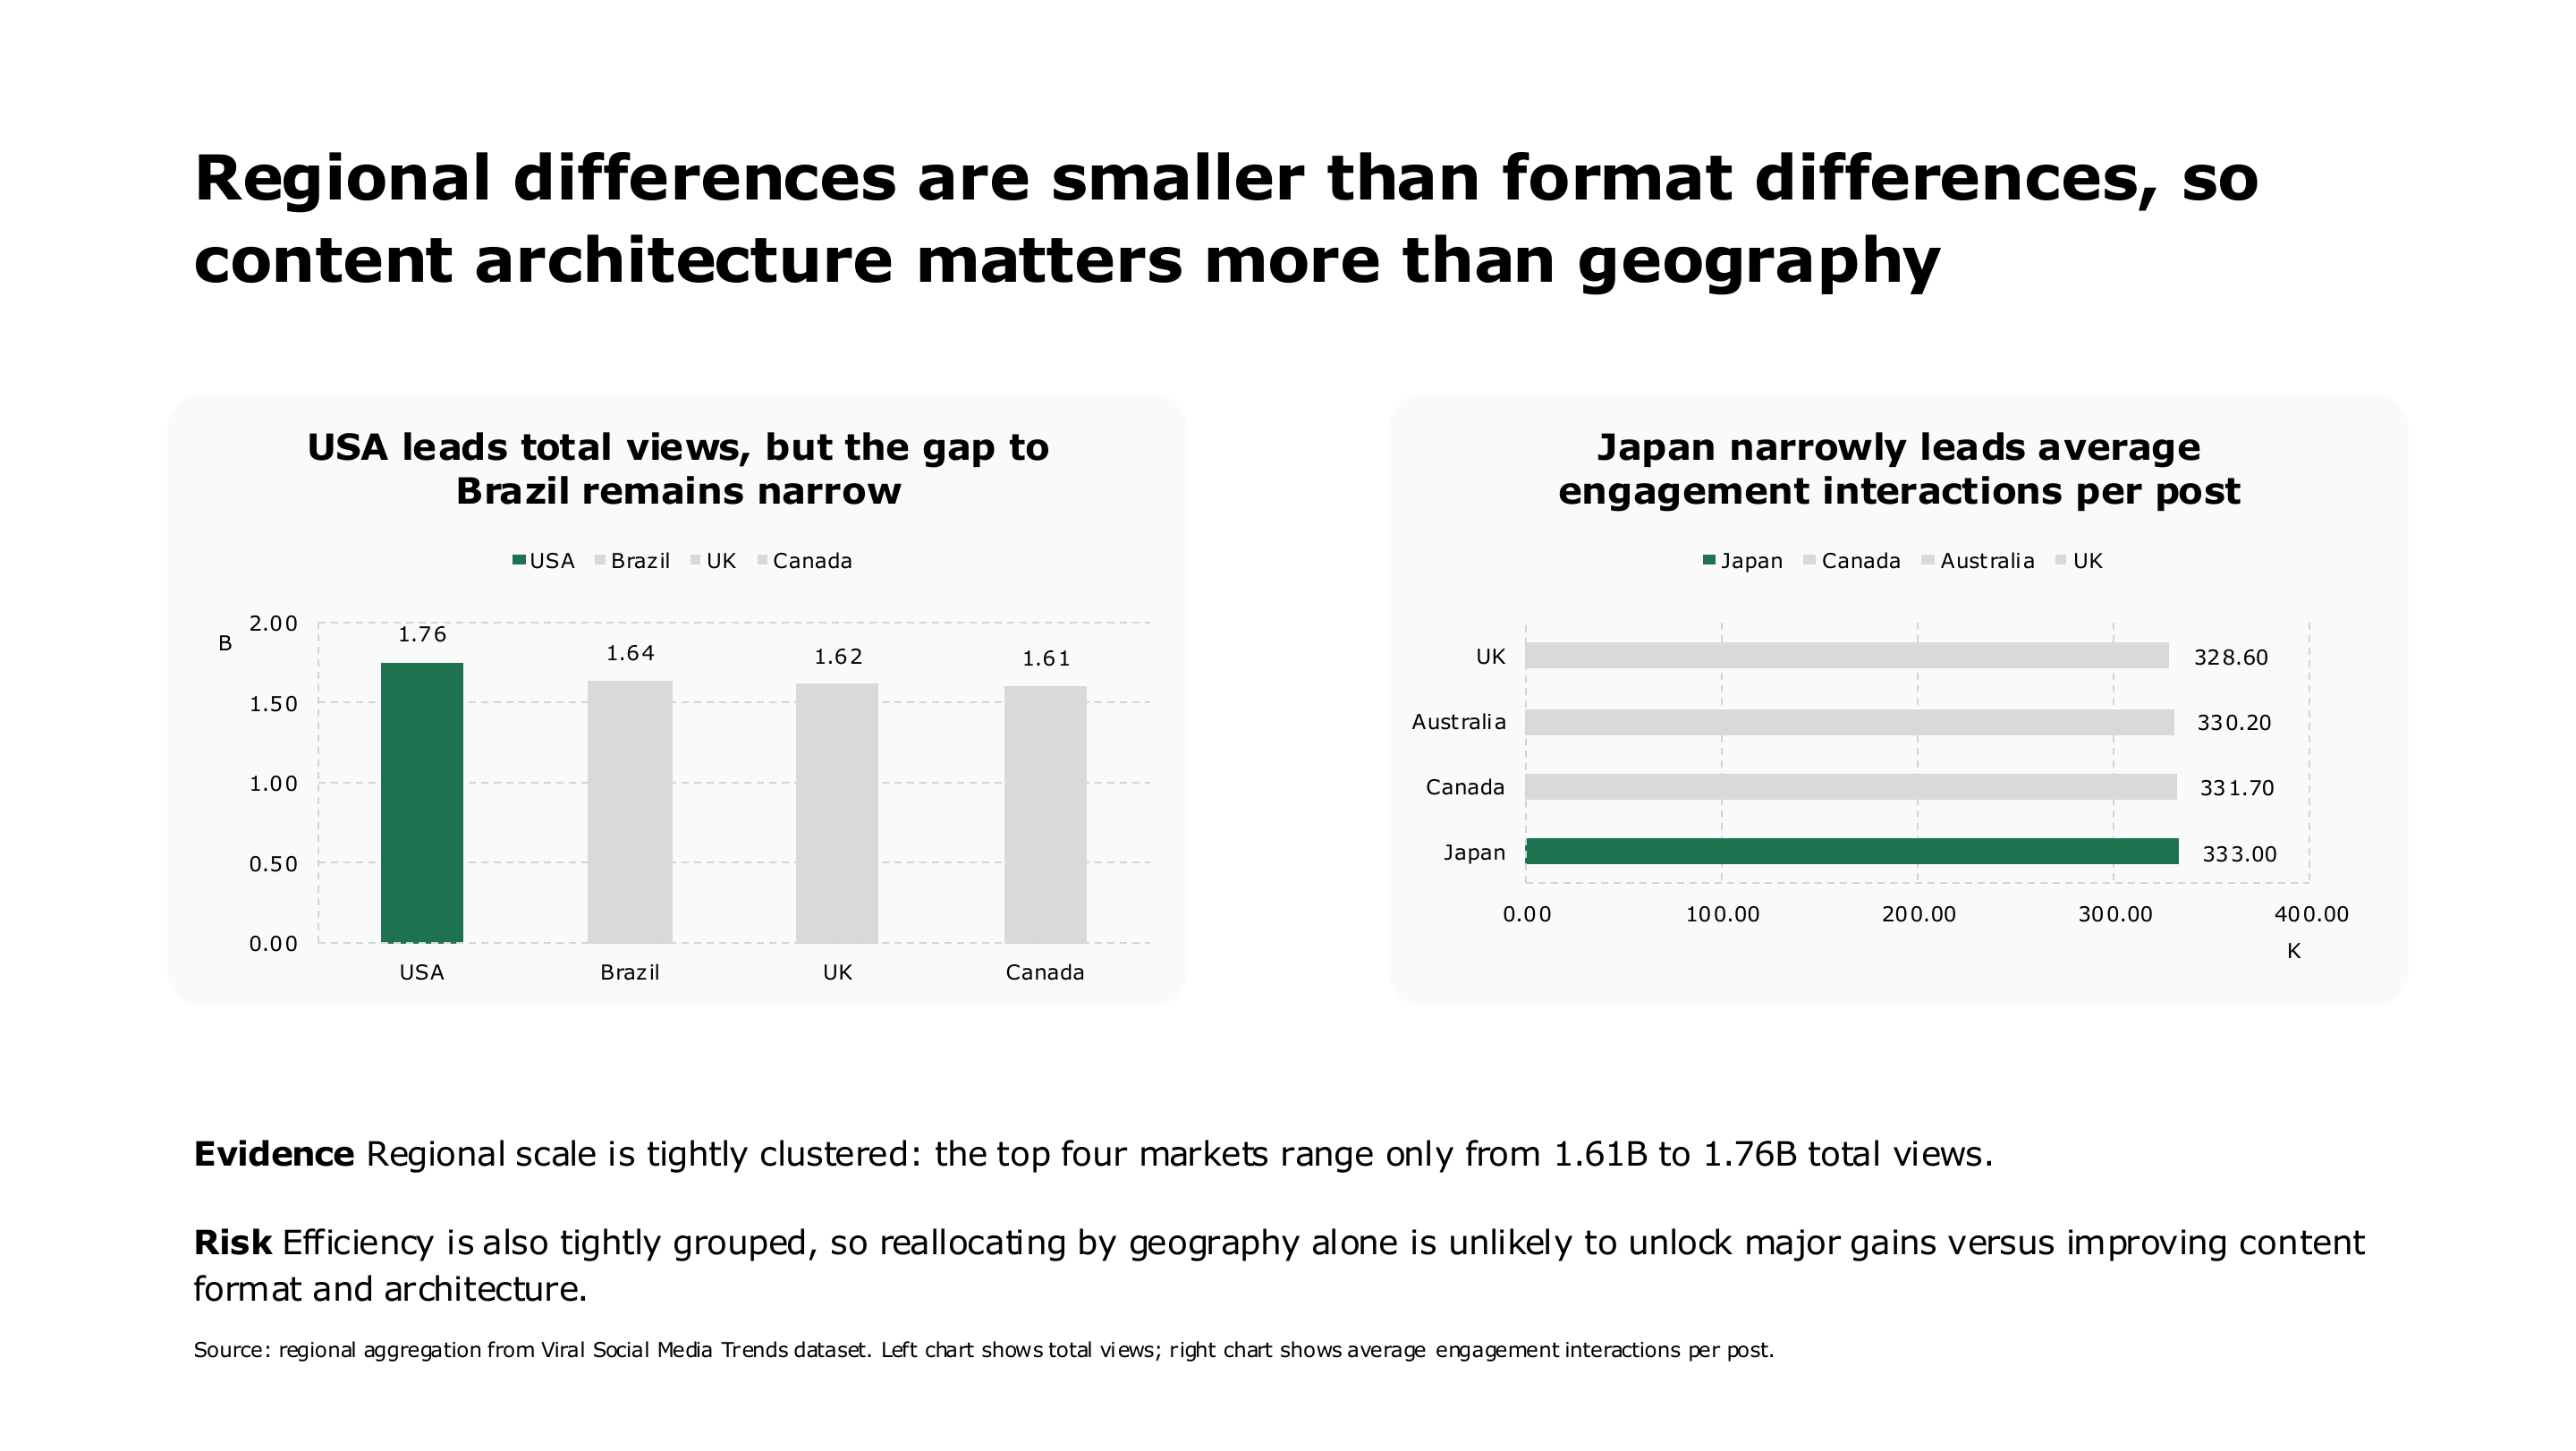
Regional social media reach and engagement comparison — page 8 of 16
Regional social media reach and engagement comparison
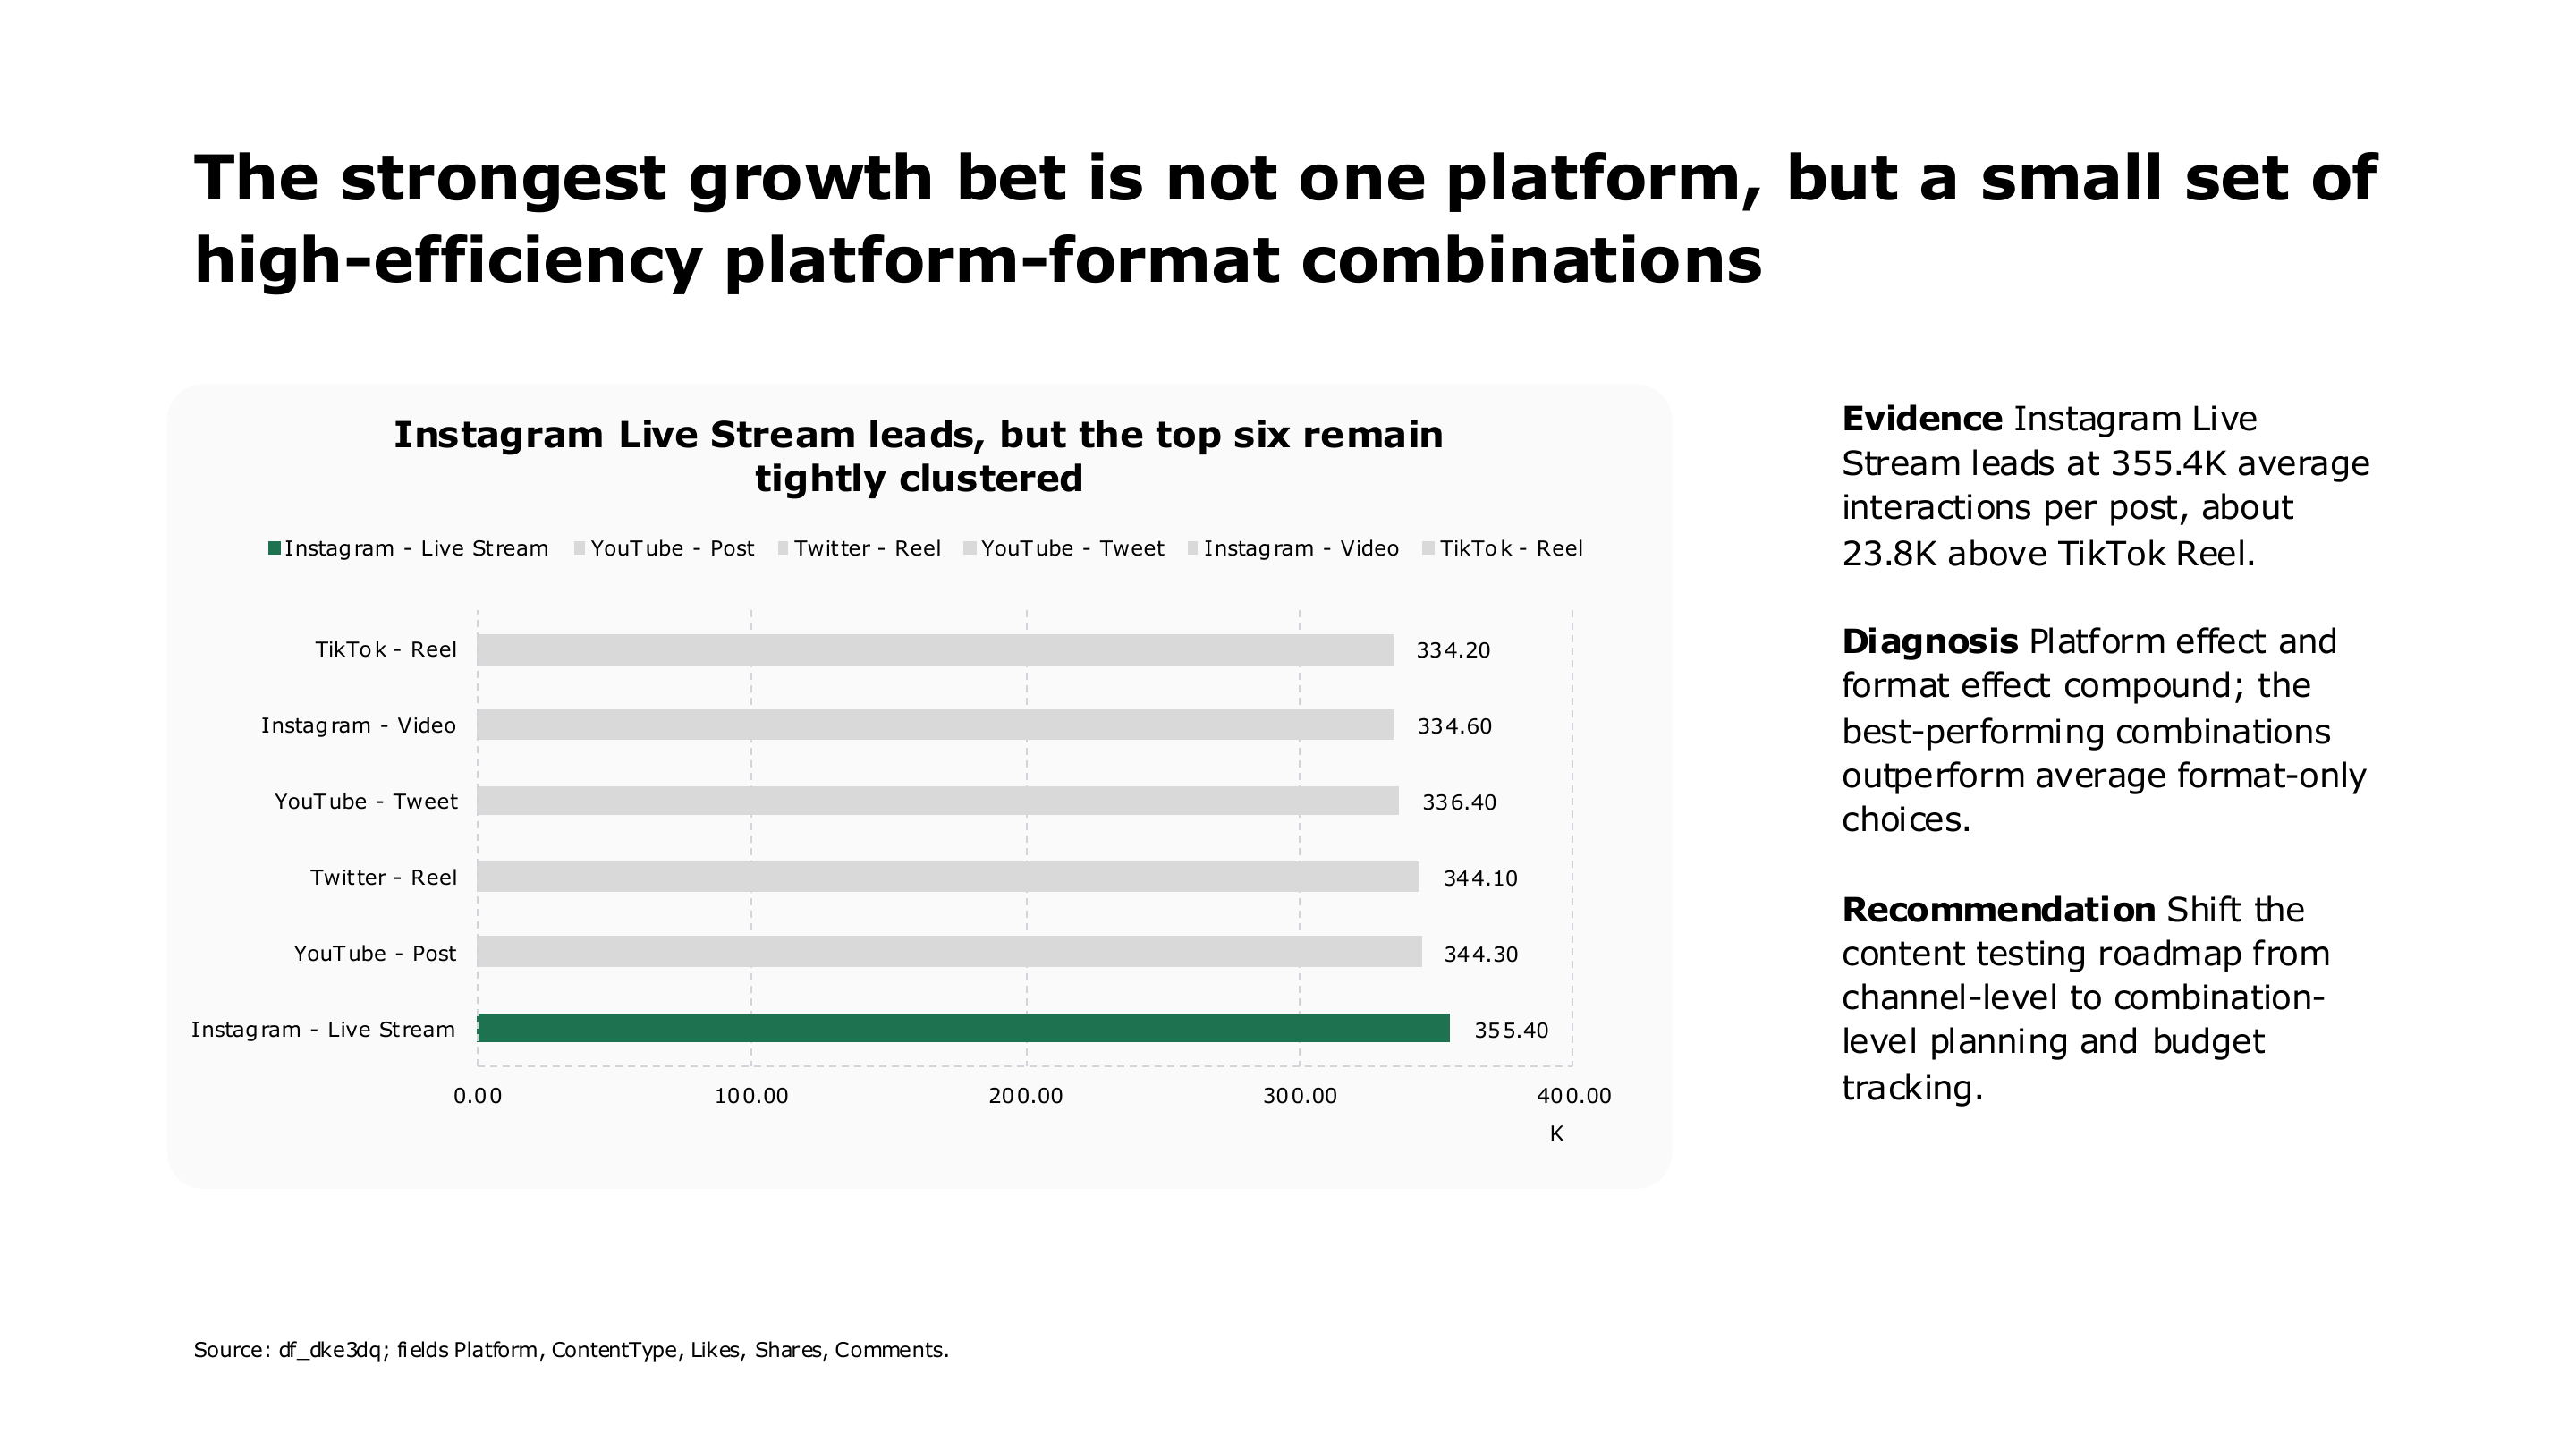
High-efficiency platform and content format combinations — page 9 of 16
High-efficiency platform and content format combinations
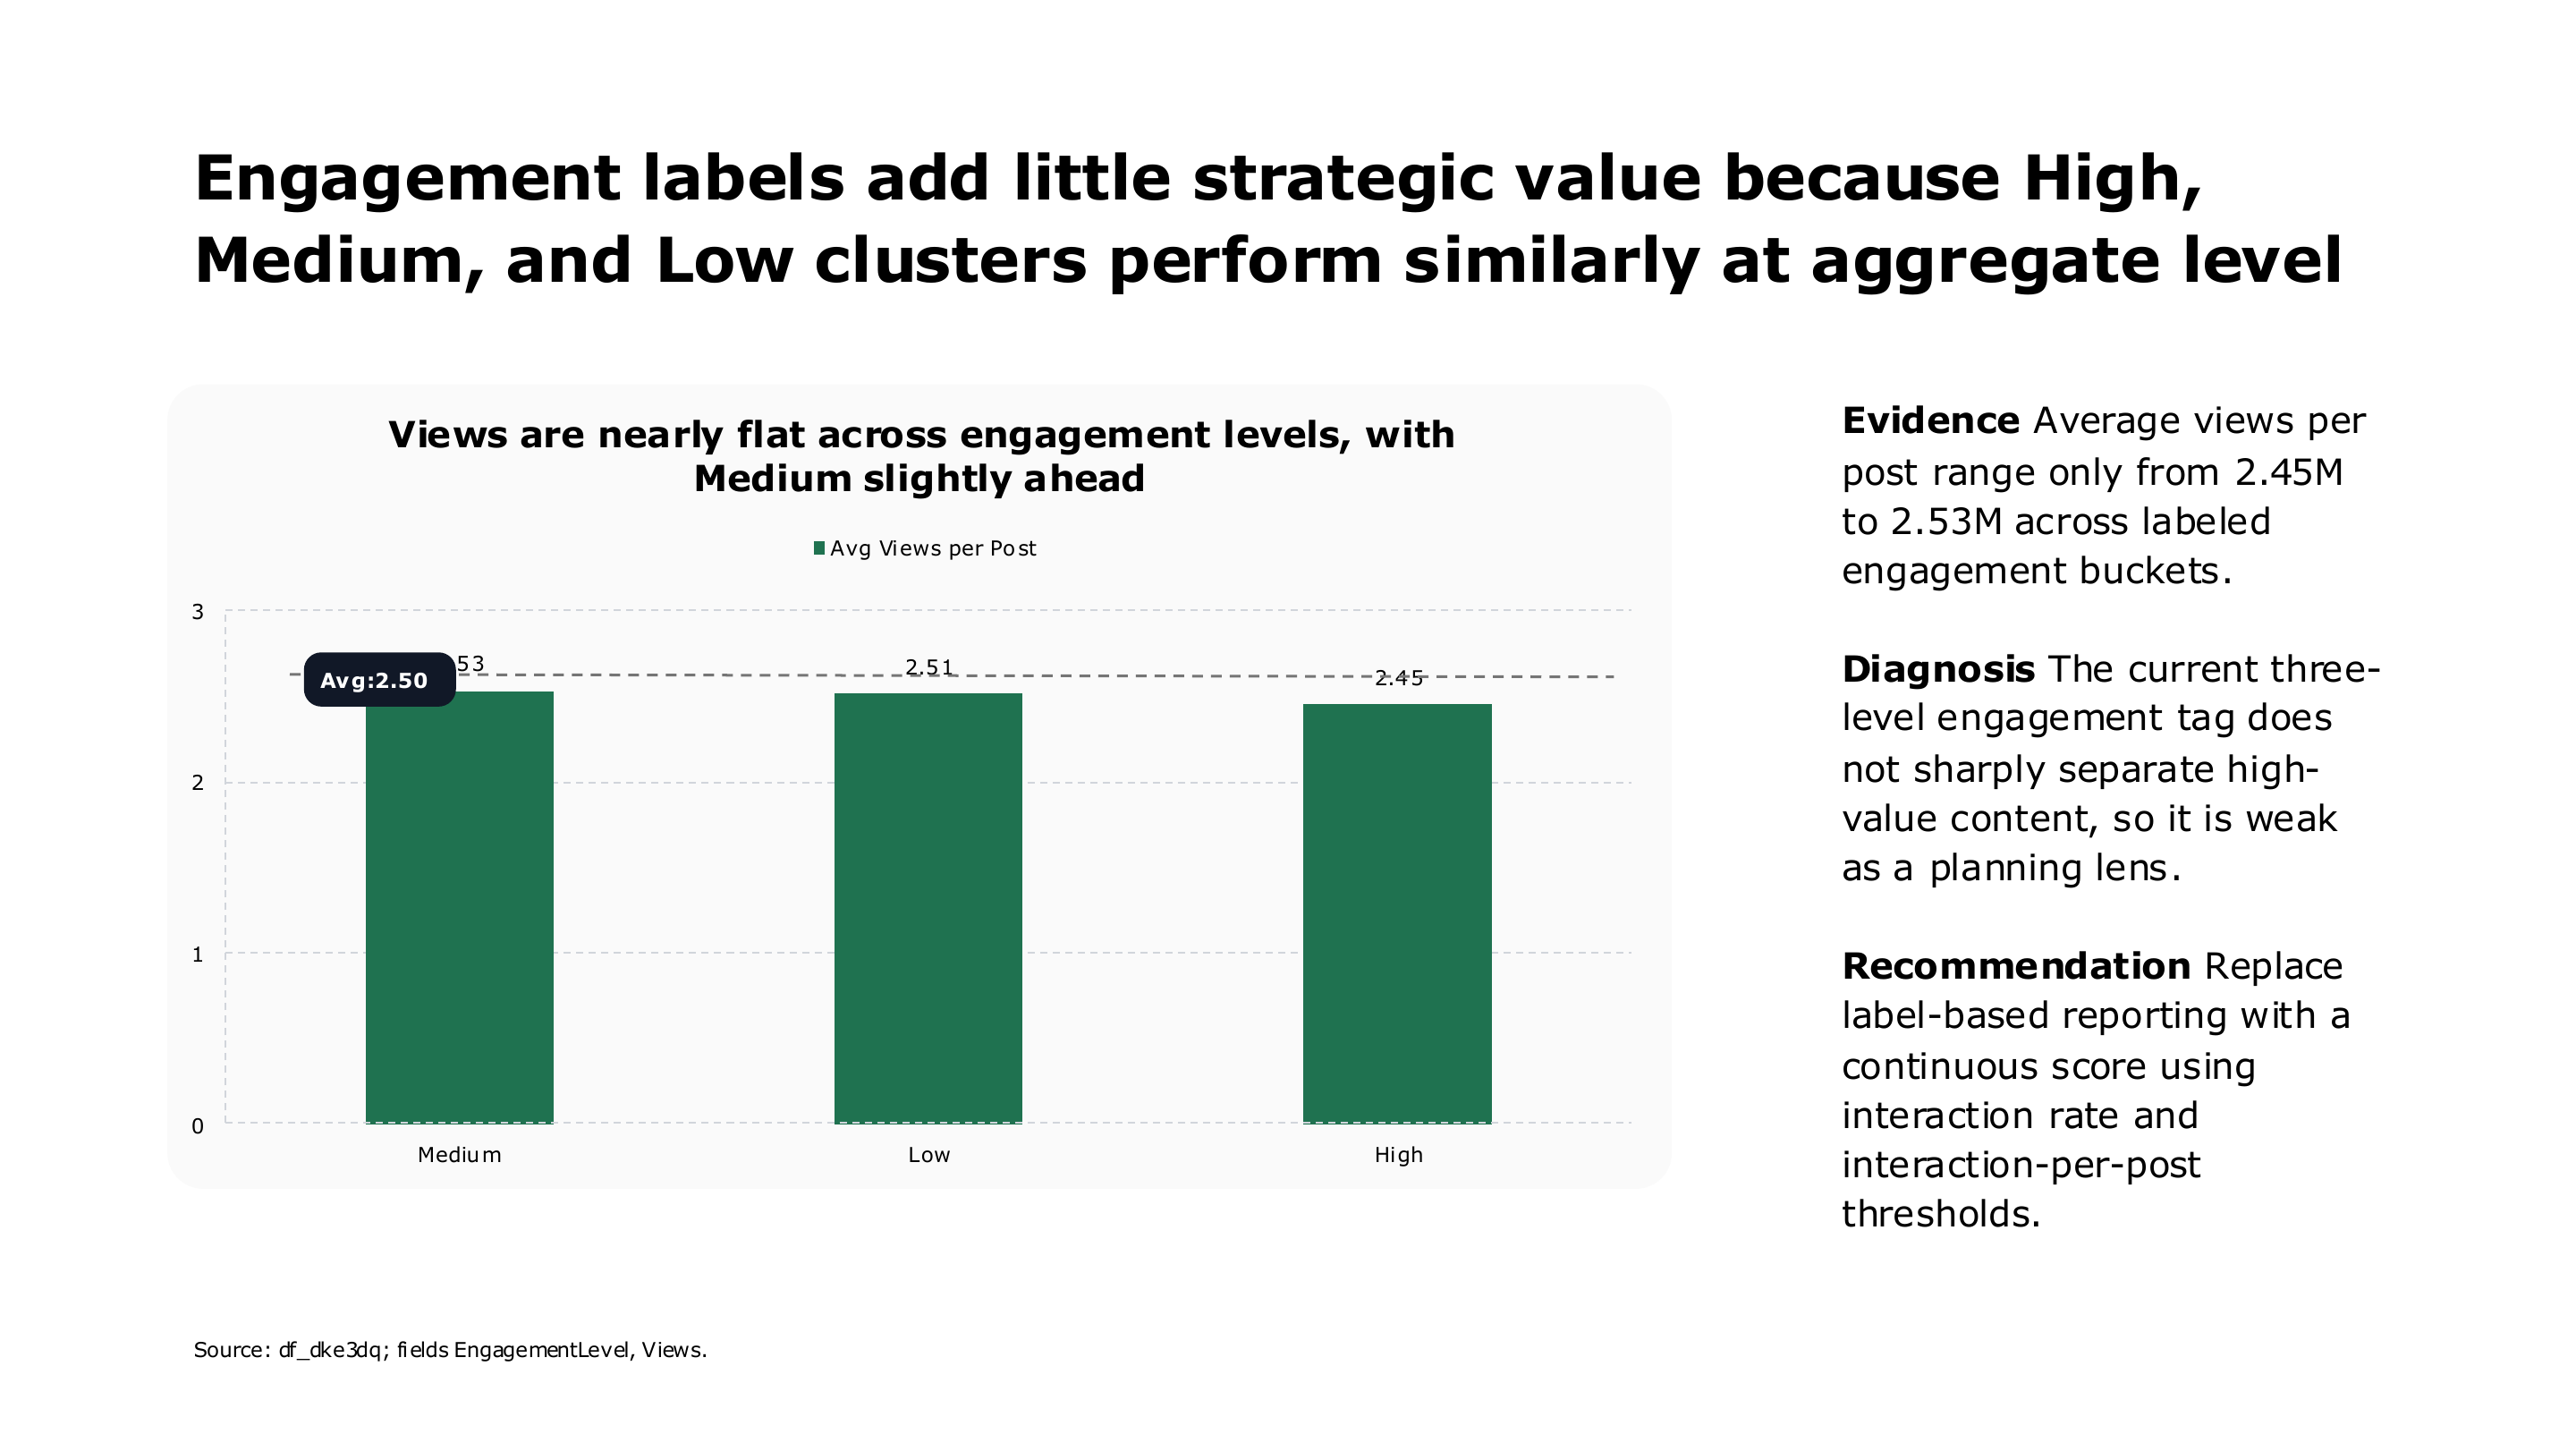
Engagement label effectiveness analysis — page 10 of 16
Engagement label effectiveness analysis
Social media scale versus interaction efficiency — page 11 of 16
Social media scale versus interaction efficiency
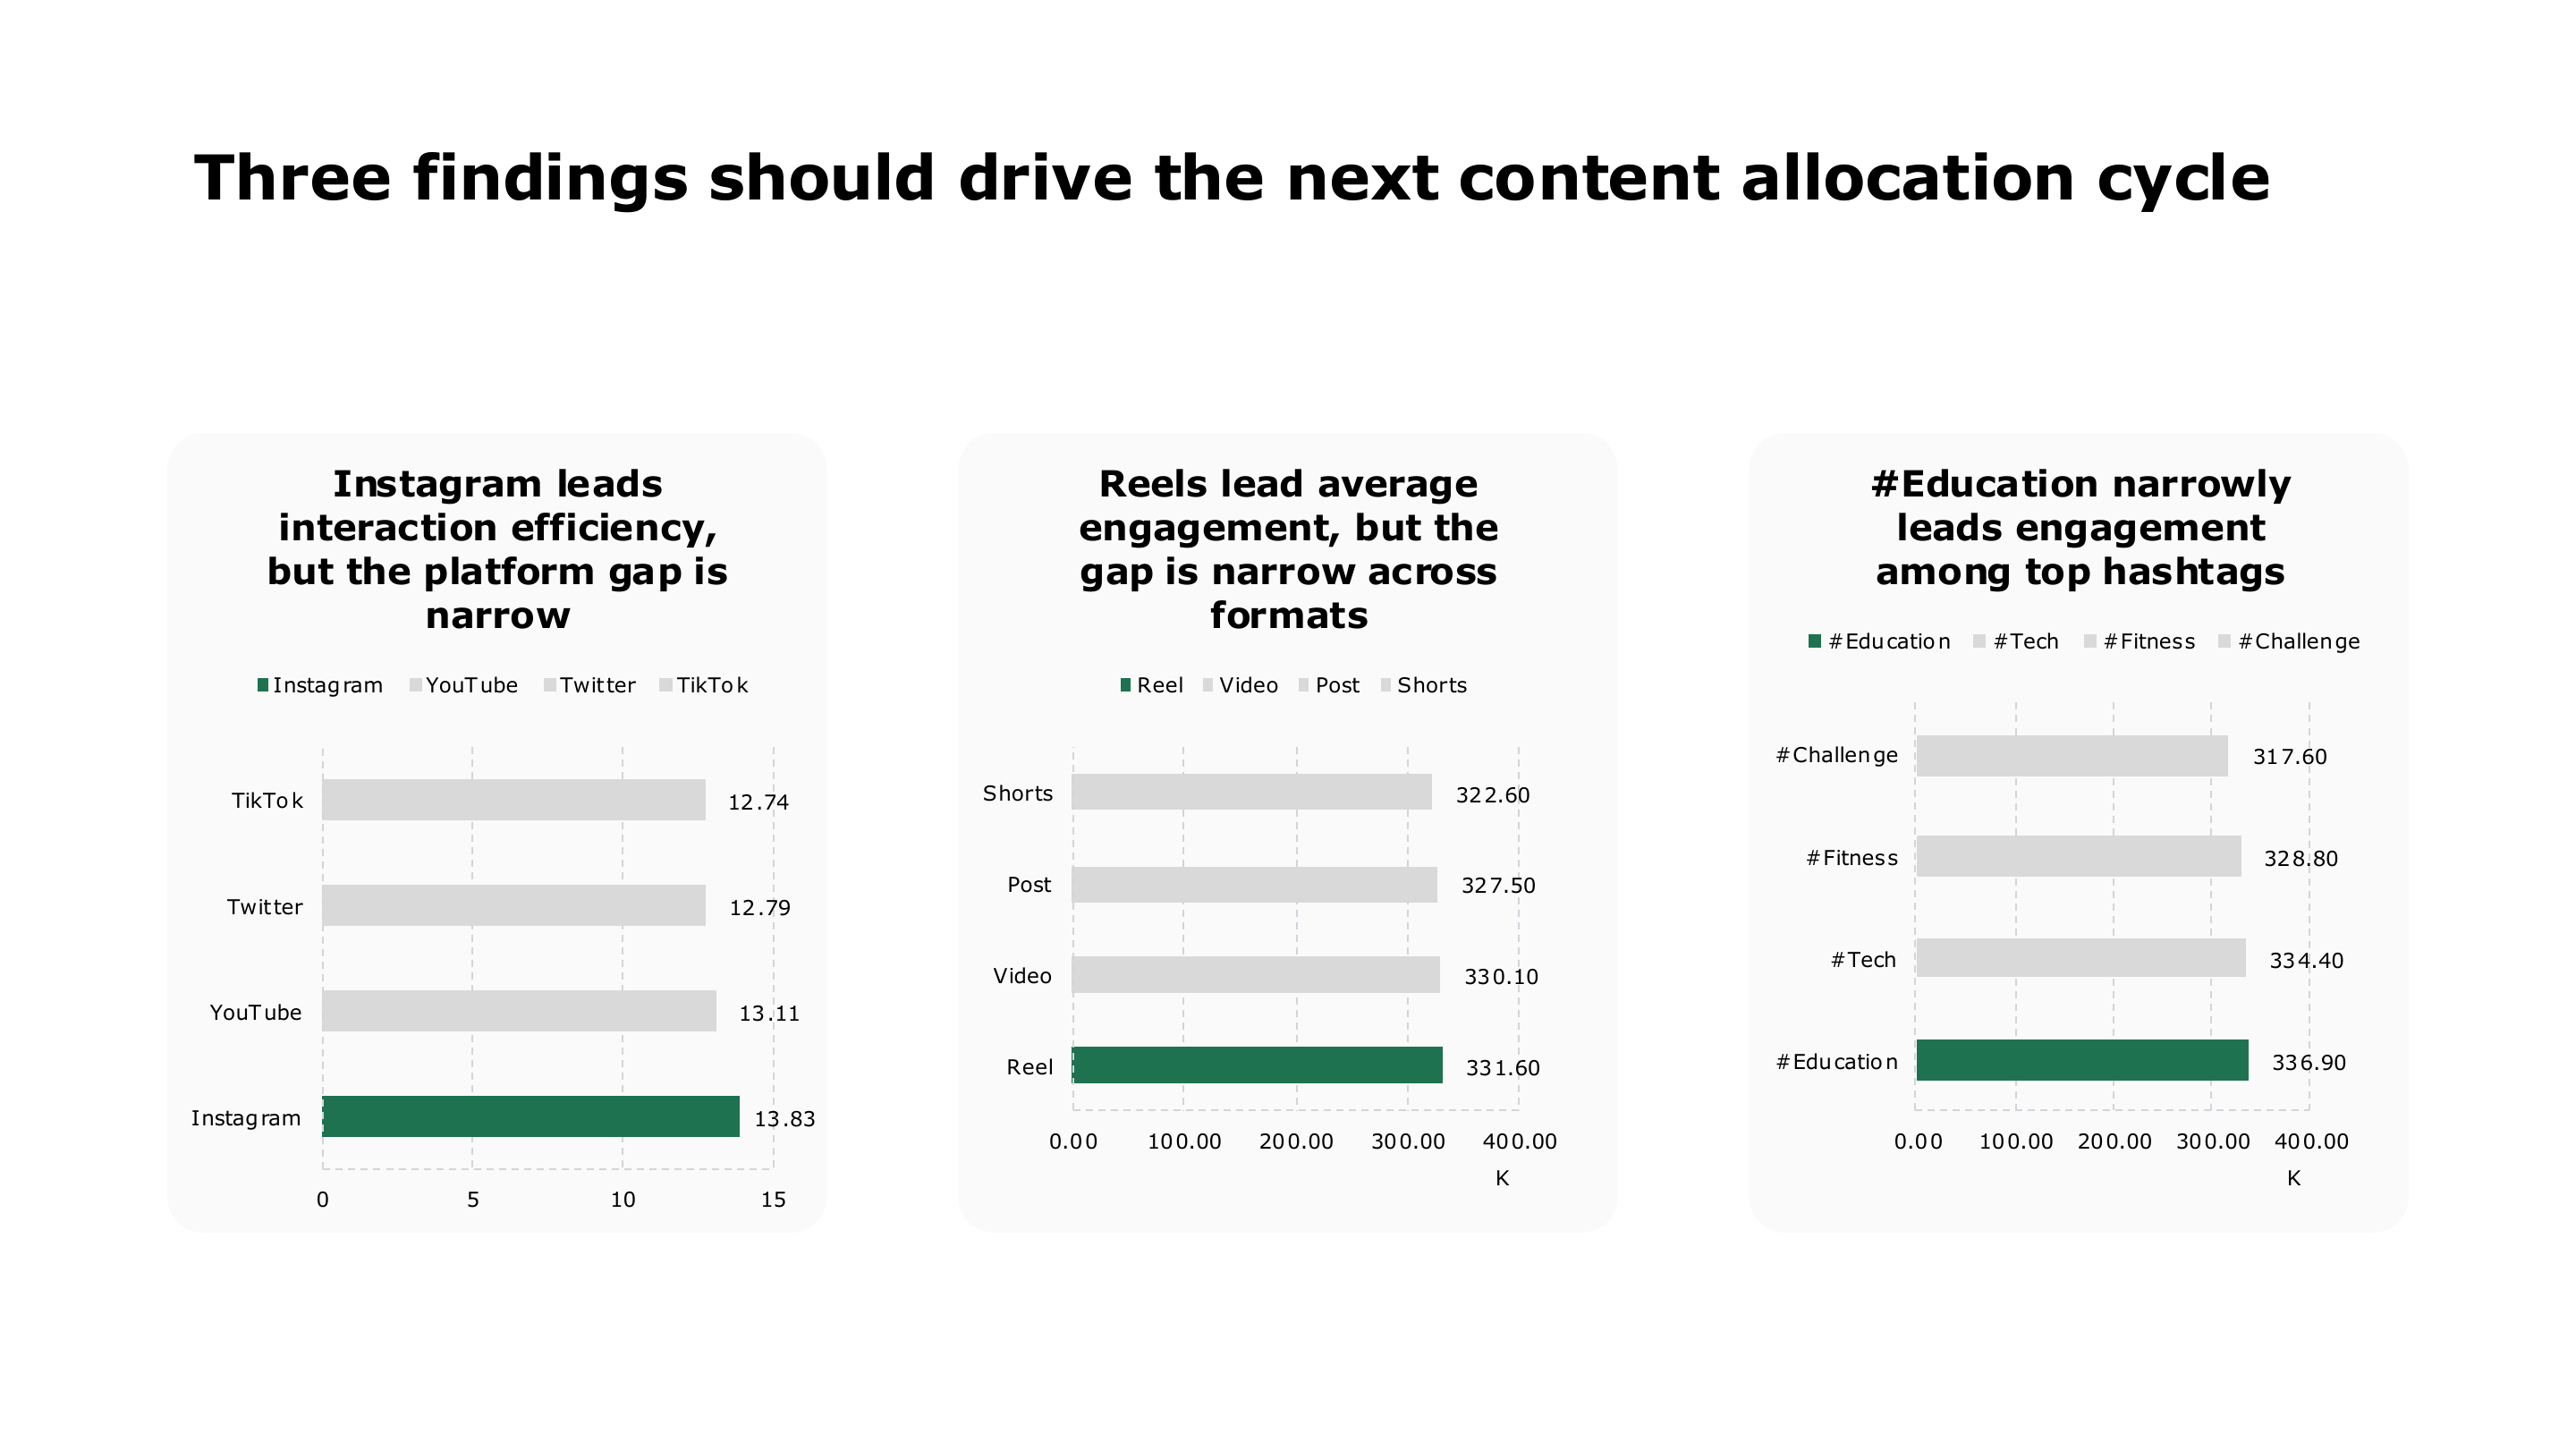
Key findings for platform, format, and hashtag performance — page 12 of 16
Key findings for platform, format, and hashtag performance
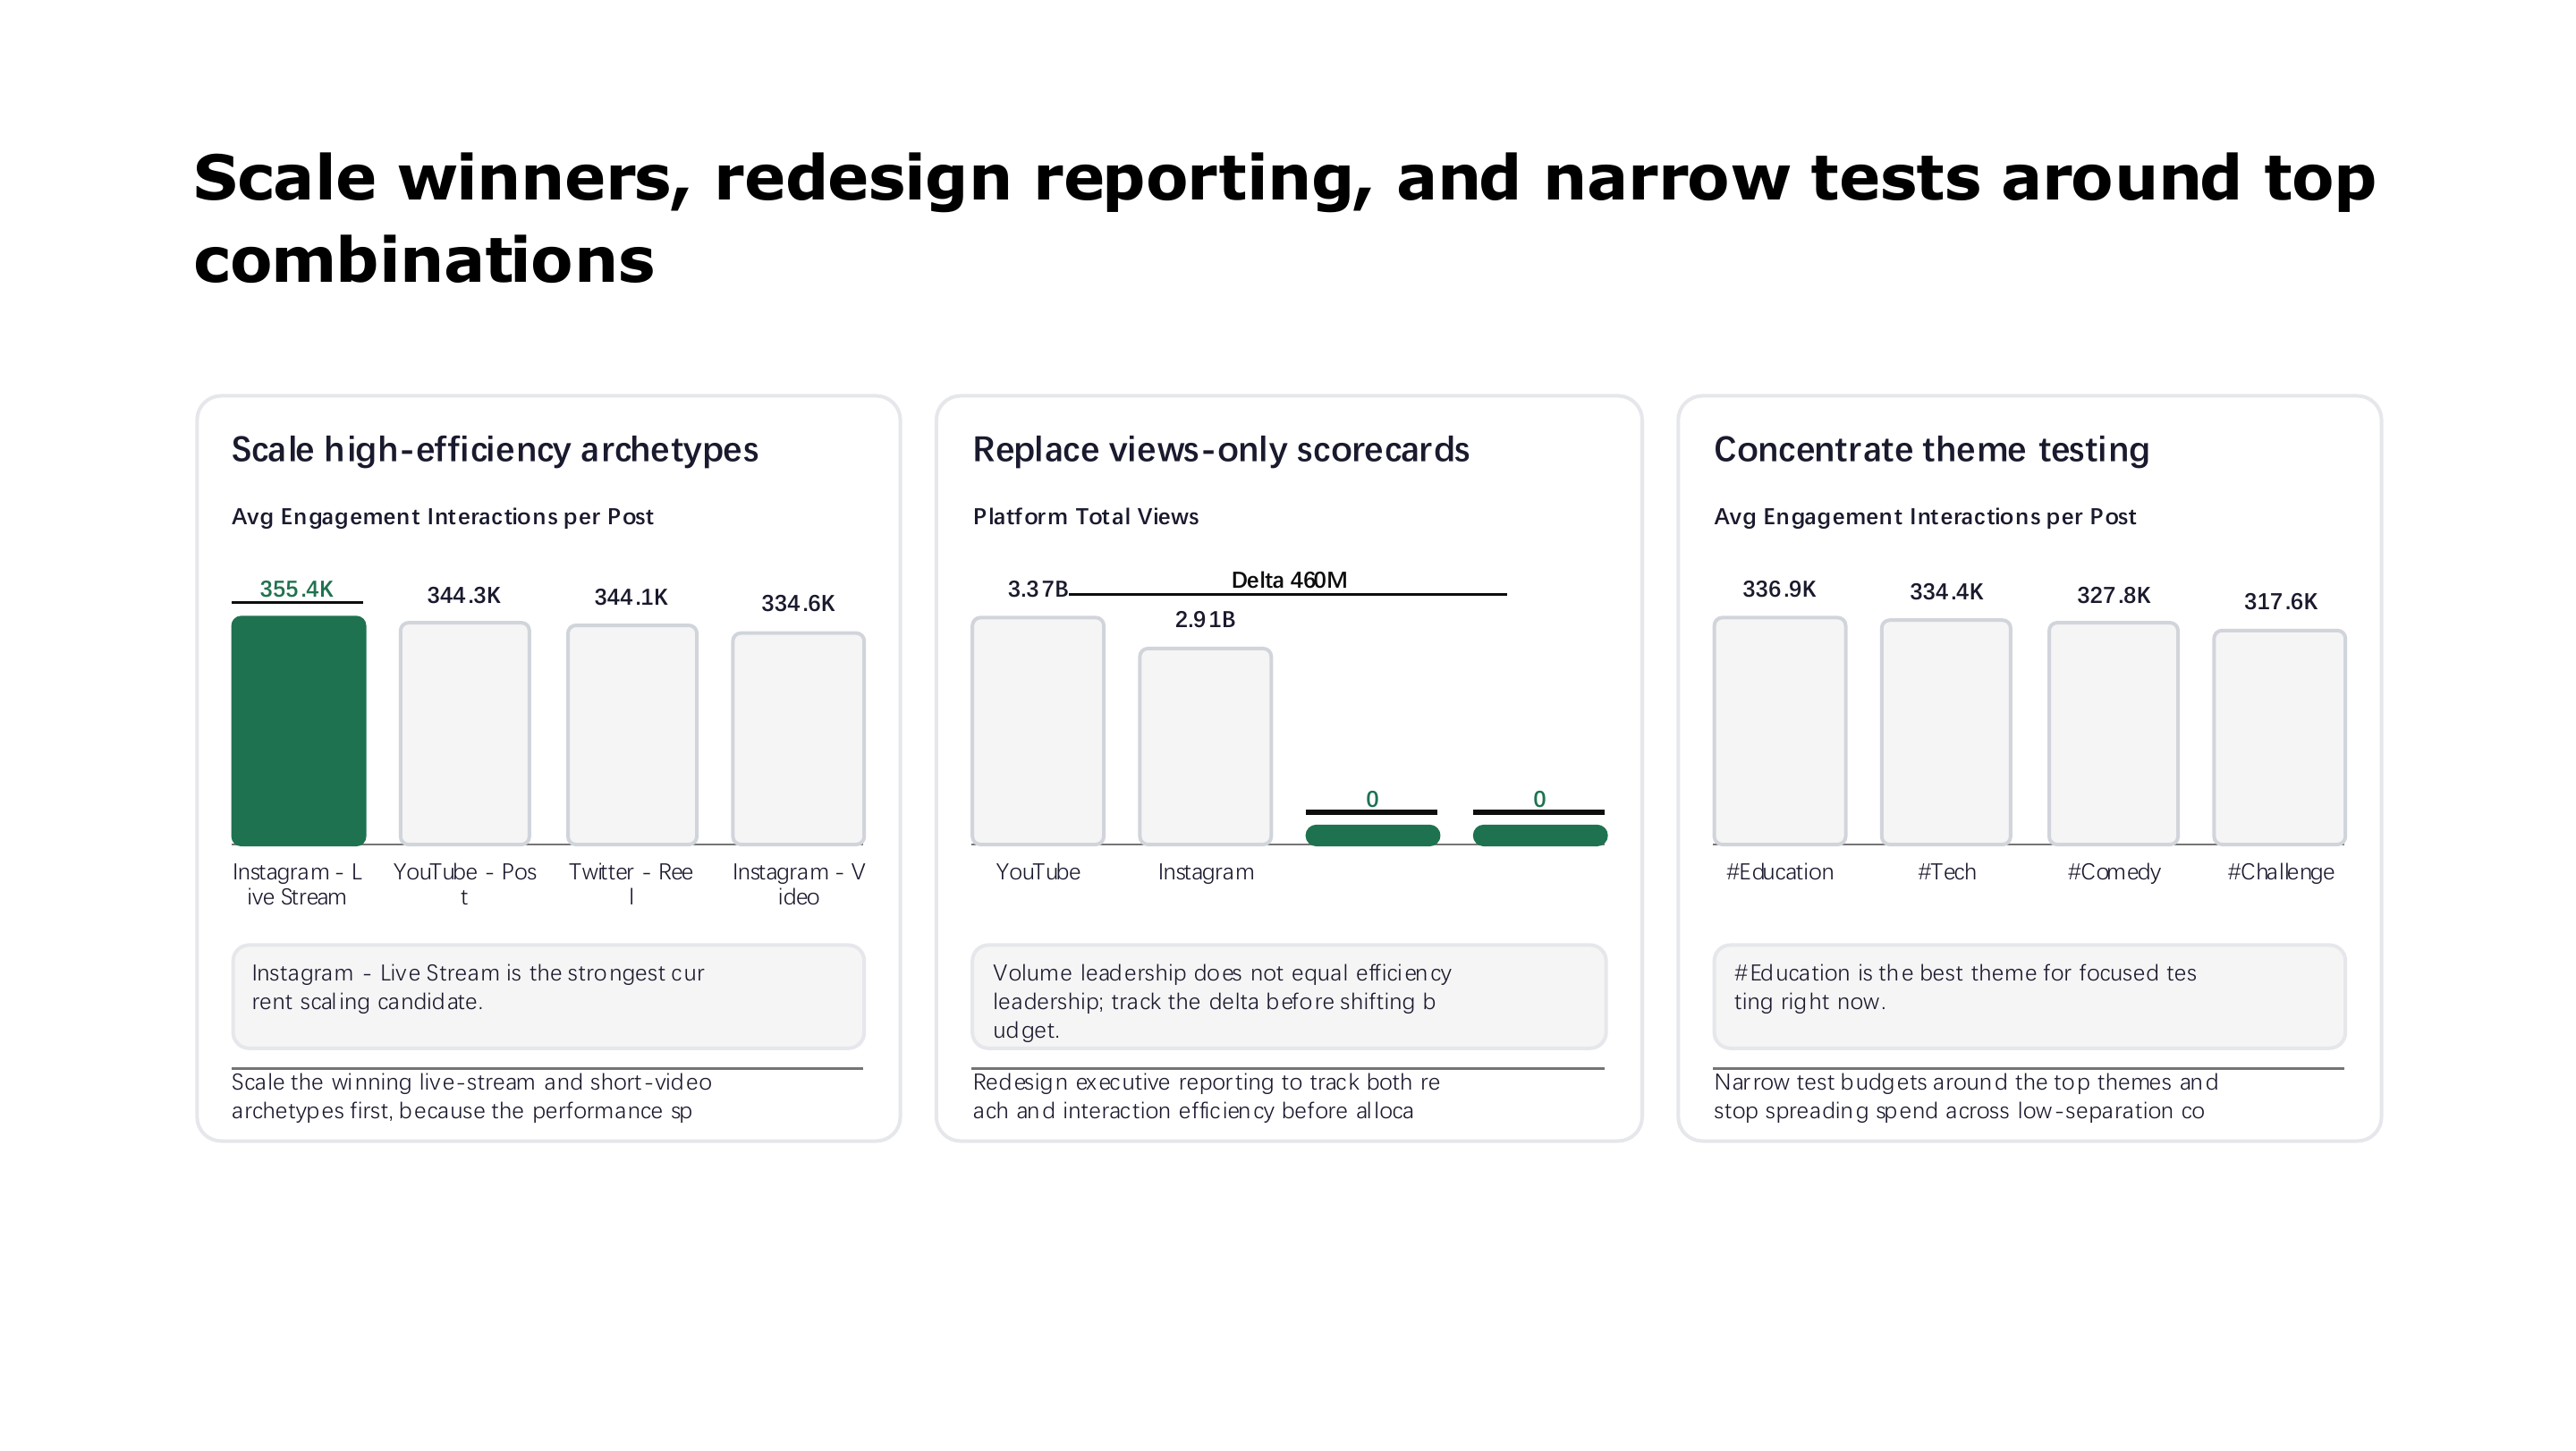
Content allocation recommendations and testing priorities — page 13 of 16
Content allocation recommendations and testing priorities
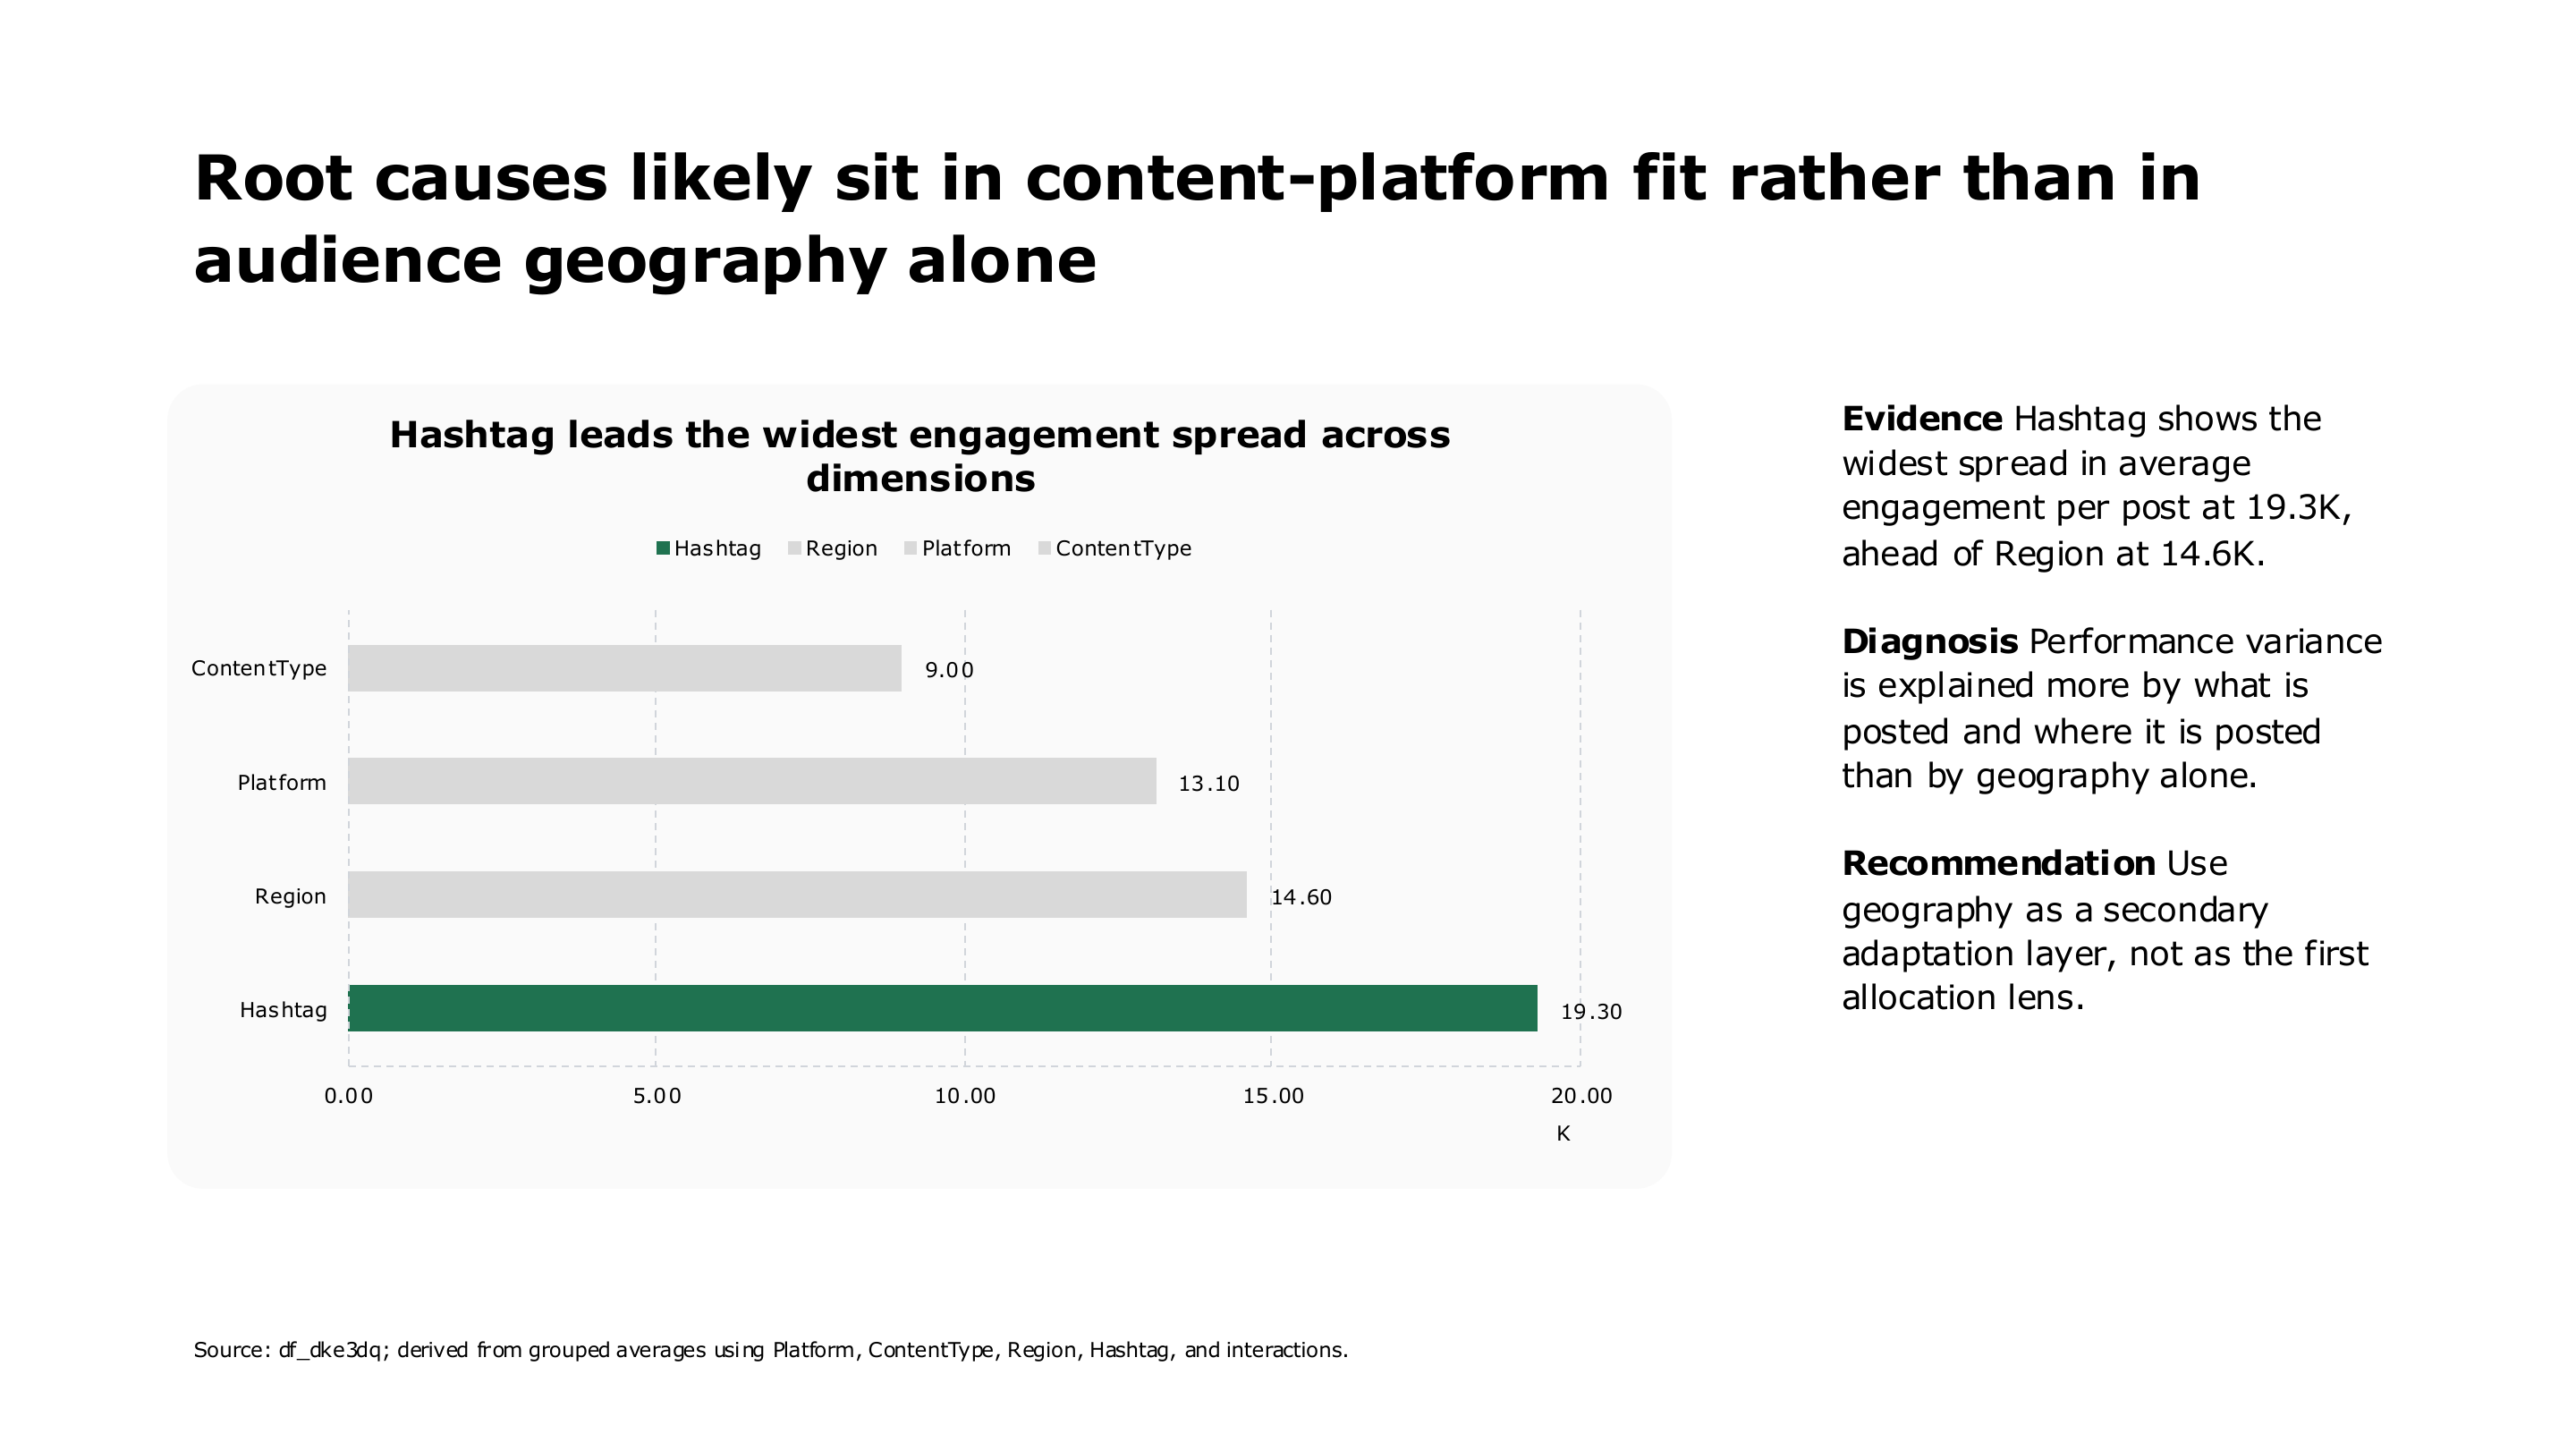
Social media performance root cause analysis — page 14 of 16
Social media performance root cause analysis
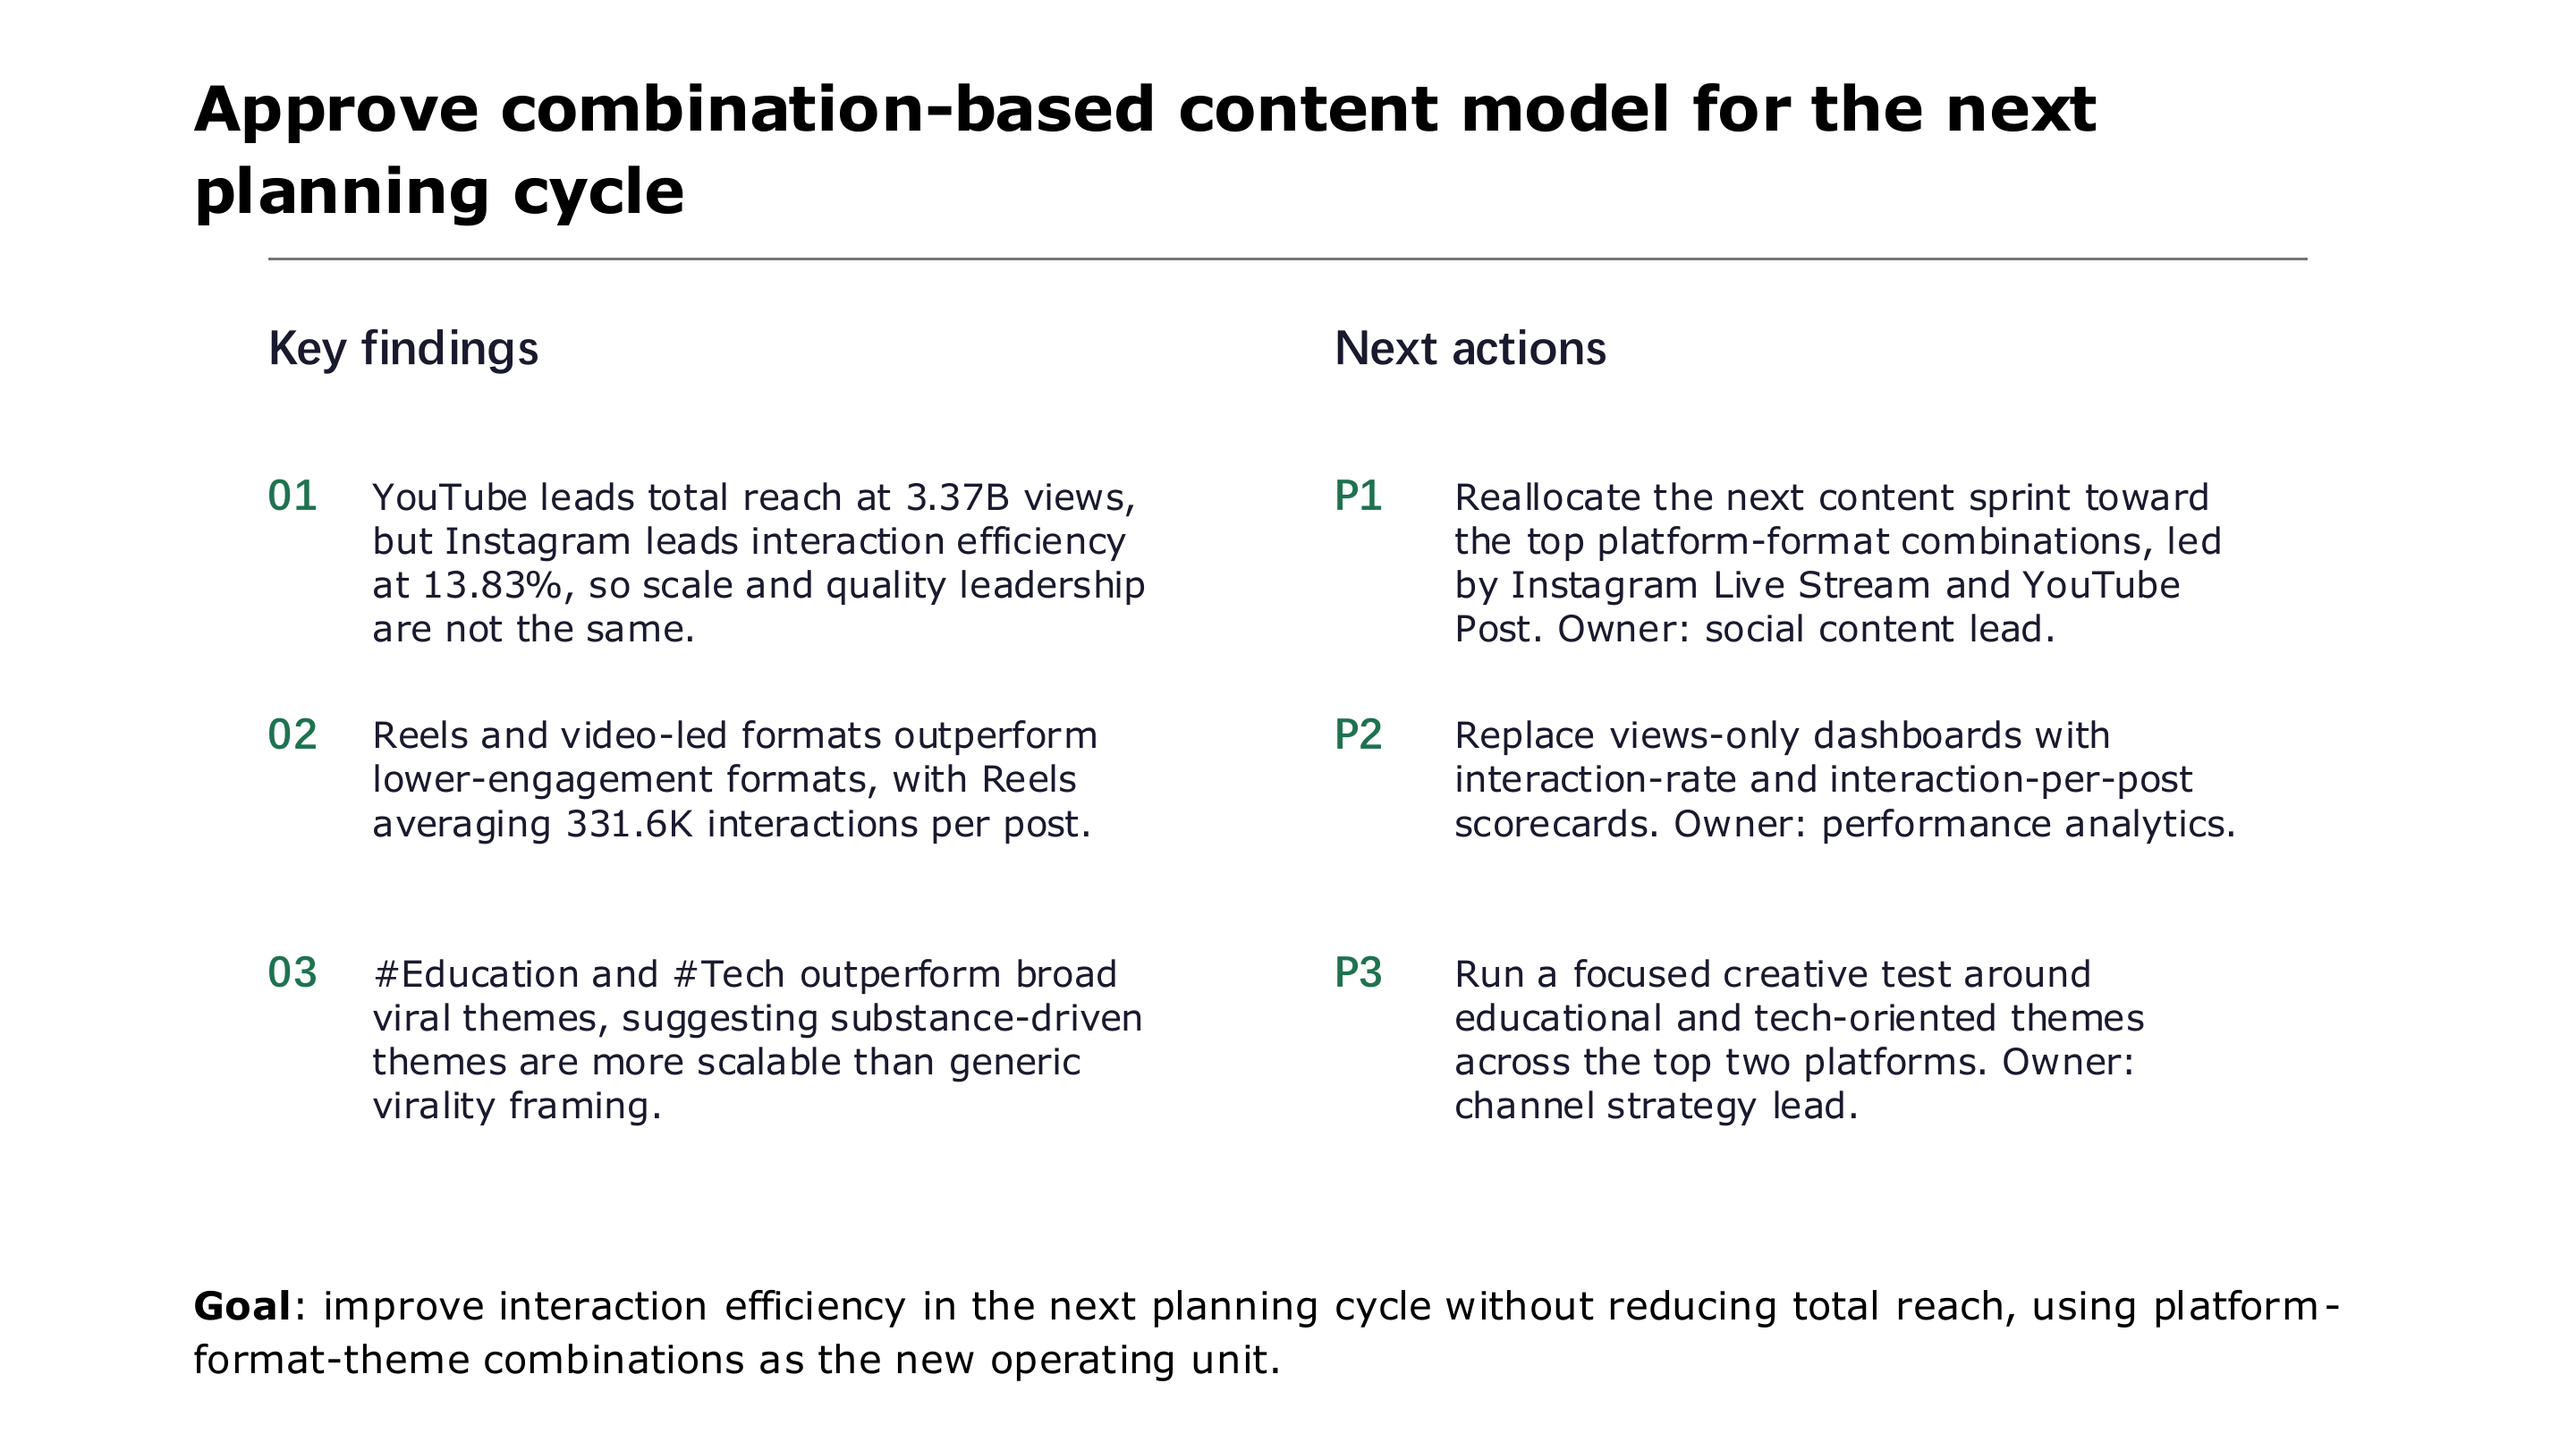
Combination-based content model key findings and next actions — page 15 of 16
Combination-based content model key findings and next actions
Viral Social Media Performance Review closing page — page 16 of 16
Viral Social Media Performance Review closing page
01 / 16

스프레드시트에서 프레젠테이션까지

AI 데이터 프레젠테이션

Excel 또는 CSV를 차트, 경영진 요약, 인사이트와 제안이 포함된 프레젠테이션으로 전환합니다.

Excel 및 CSV프레젠테이션제안

더 다양한 분석 방법

지금 가진 자료로 시작하세요.

이미지, 질문 또는 스프레드시트를 워크플로를 다시 만들지 않고 명확한 답으로 바꿉니다.
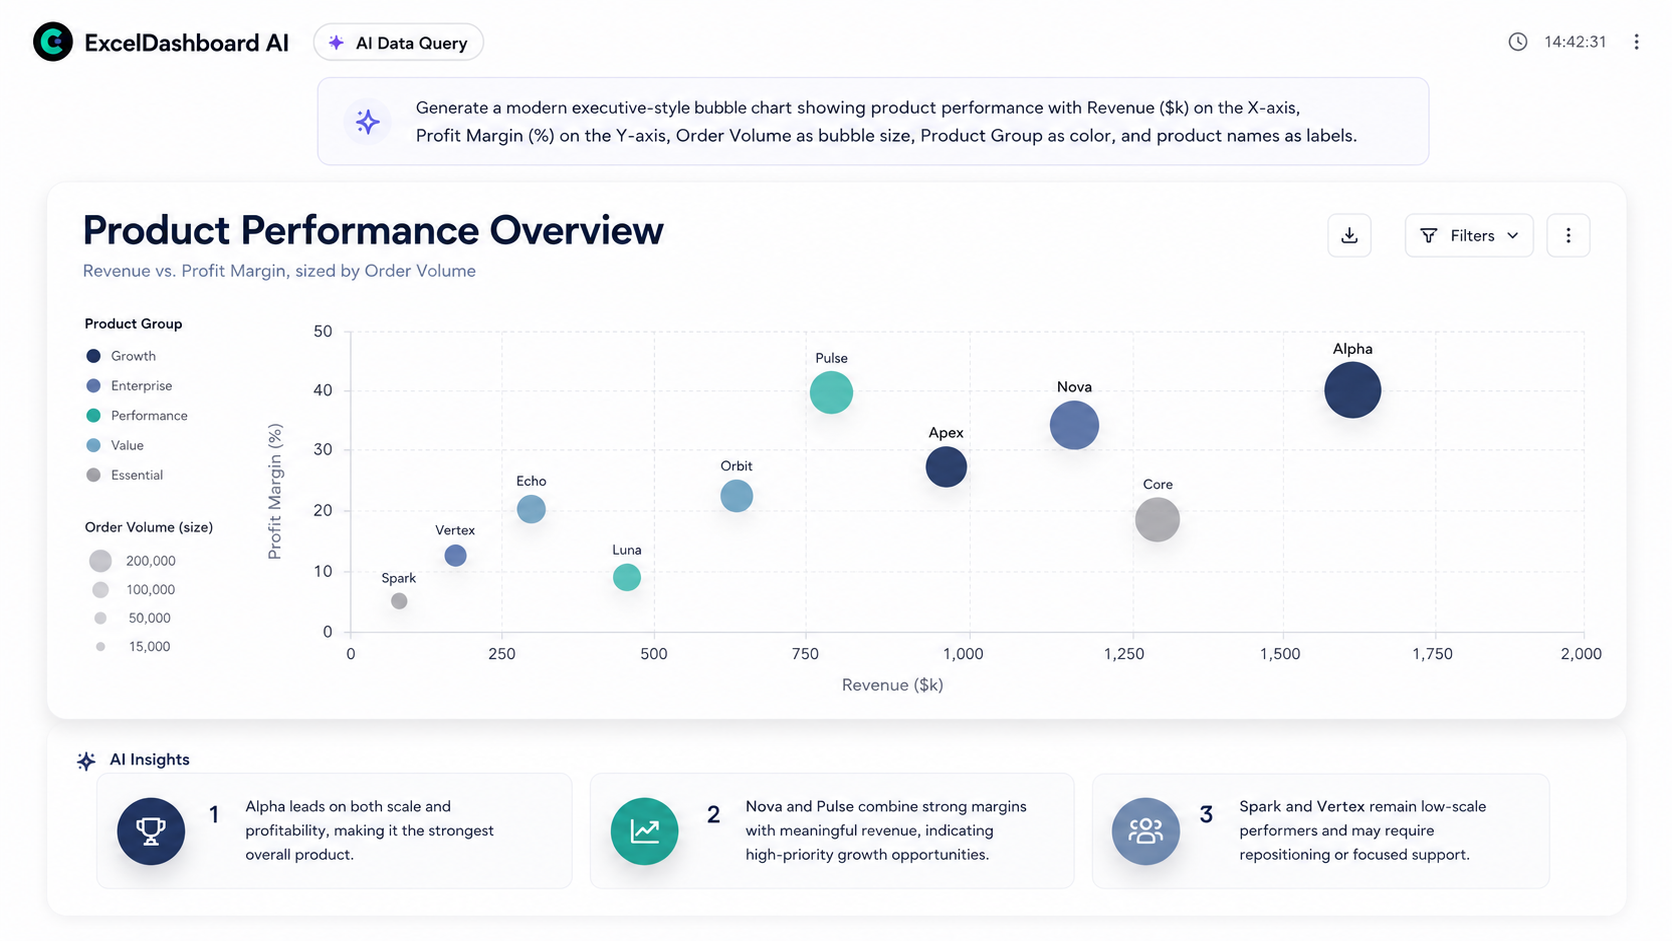
ExcelDashboard AI
A spreadsheet data question answered with charts and analysis in ExcelDashboard AI
수식이나 SQL 없이 답변데이터에서 답변 생성