Generating AI Reports Is Easy. Trusting Them Is Hard.

Yang Li
Founder, ExcelDashboard AI
Published6 min read
Unsupported claims stop here ×
No evidence, no delivery.
Verified for delivery ✓
When we started building ExcelDashboard AI, most of our attention went into the visible part of the product. Could AI read a messy spreadsheet? Could it find something useful in the data? Could it turn that into charts and a PowerPoint someone would actually present? For a long time, that felt like the problem.
It doesn't anymore. AI has become surprisingly good at producing something that looks like a finished report. Sometimes very good. And that's where things started to get uncomfortable.
Some of the reports that look the most convincing are also the ones I trust the least.
Not because the charts are obviously wrong. Not because the numbers are completely made up. The harder cases are much less obvious. Everything looks reasonable. Until you ask: why?
A Report Can Be Right About the Number and Wrong About the Story
I remember reviewing a report where the numbers were fine. The charts looked fine too. Then I read the explanation under one of them. It sounded completely reasonable. The problem was that I couldn't find enough evidence in the data to support what it was saying.
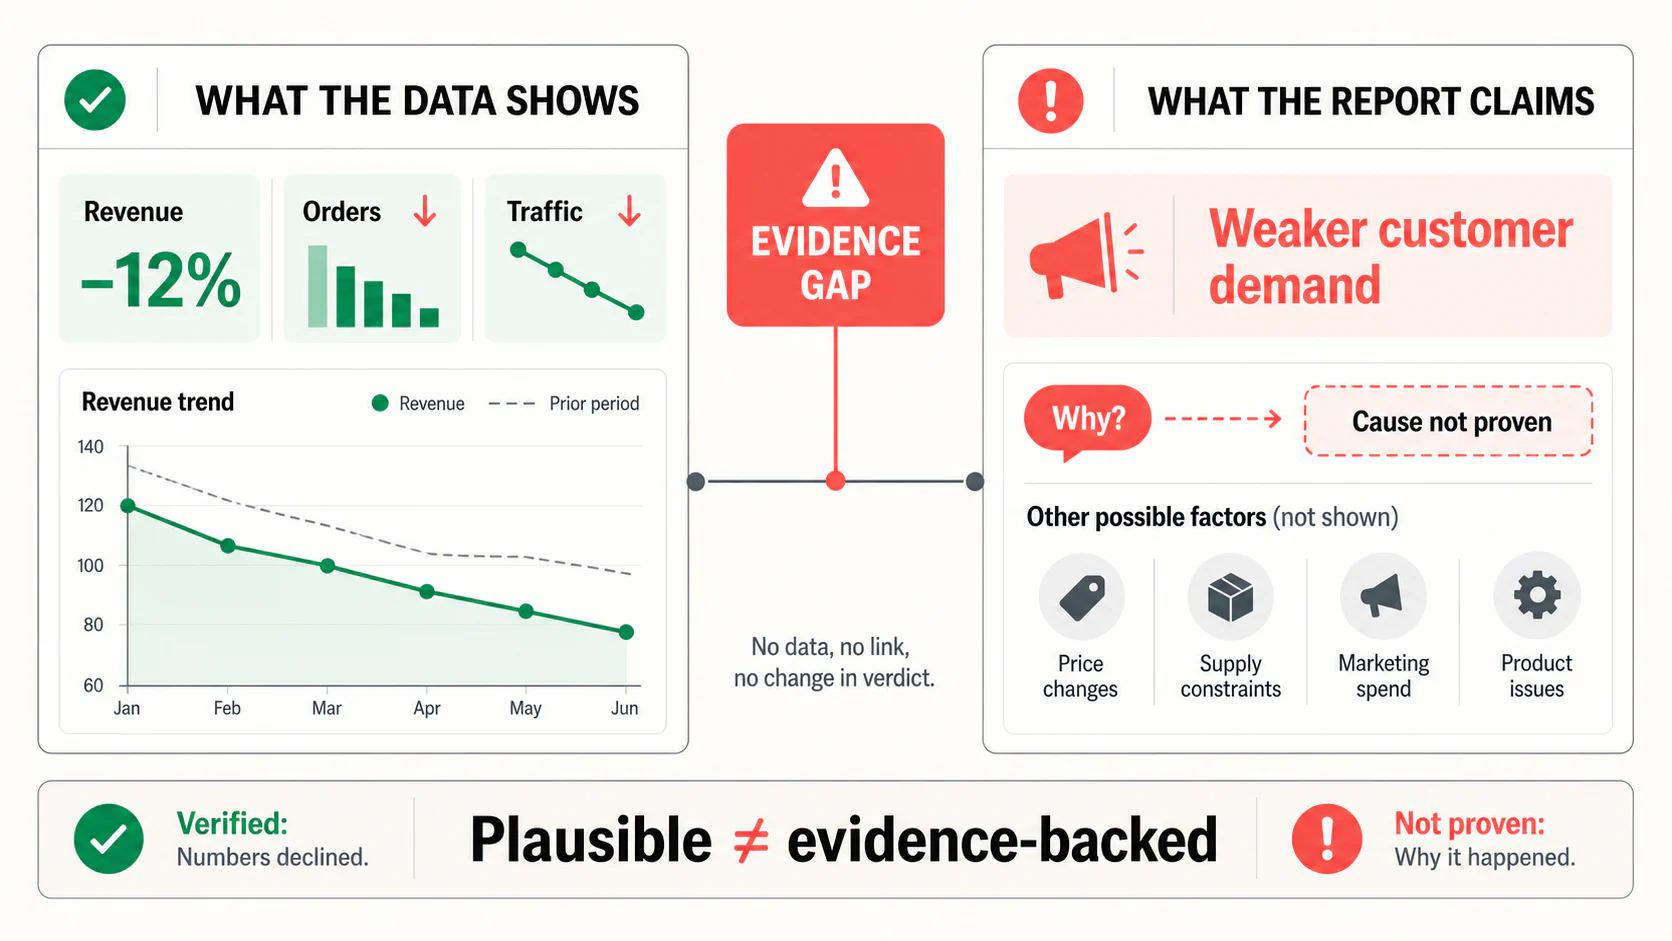
Nothing looked obviously broken. That was exactly what bothered me. Imagine a monthly e-commerce report showing revenue down 12%.
Revenue declined primarily because of weaker customer demand.
Maybe. But what if the data only shows that revenue, orders, and traffic declined? Those numbers tell us something happened. They don't necessarily tell us why. “Weaker customer demand” is a reasonable story.
There are probably several other reasonable stories too. This is a distinction we've become much more careful about:
A plausible explanation is not the same as an evidence-backed insight.
The strange thing is that this problem gets easier to miss as AI gets better. Bad writing makes you suspicious. Confident, polished writing often does the opposite.
We Originally Thought Accuracy Was the Main Problem
Early on, I thought the reliability problem would mostly come down to calculations. Did AI calculate growth correctly? Did it use the right denominator? Did it compare the right periods? Those problems are real, but they turned out to be only part of it.
Sometimes the number is correct and the interpretation is still questionable. Even a basic field like “Sales” can mean different things depending on the source system, the business, or the person reading the report. Revenue can mean different things too. The same goes for customers, conversions, margin, and dozens of other business metrics. This sounds like a small issue until an entire analysis is built on top of the wrong interpretation.
Then there is another problem we kept seeing. AI is very good at finding things. Maybe too good. Give it enough data and it can produce a long list of observations:
- revenue fell,
- conversion changed,
- one channel underperformed,
- another product grew,
- new customers behaved differently,
- margin moved.
Most of those statements might be true. But that's not automatically a useful report. Someone still has to decide:
What actually matters here?
We don't think that question has a simple answer.
The Report Is the End of the Process, Not the Beginning
This changed the way we think about AI reporting. The obvious mental model is:
And to be fair, that already works surprisingly well for many tasks. But once we started caring about whether the output could actually support a business decision, that model felt incomplete. The high-level model we use in our own thinking is closer to:
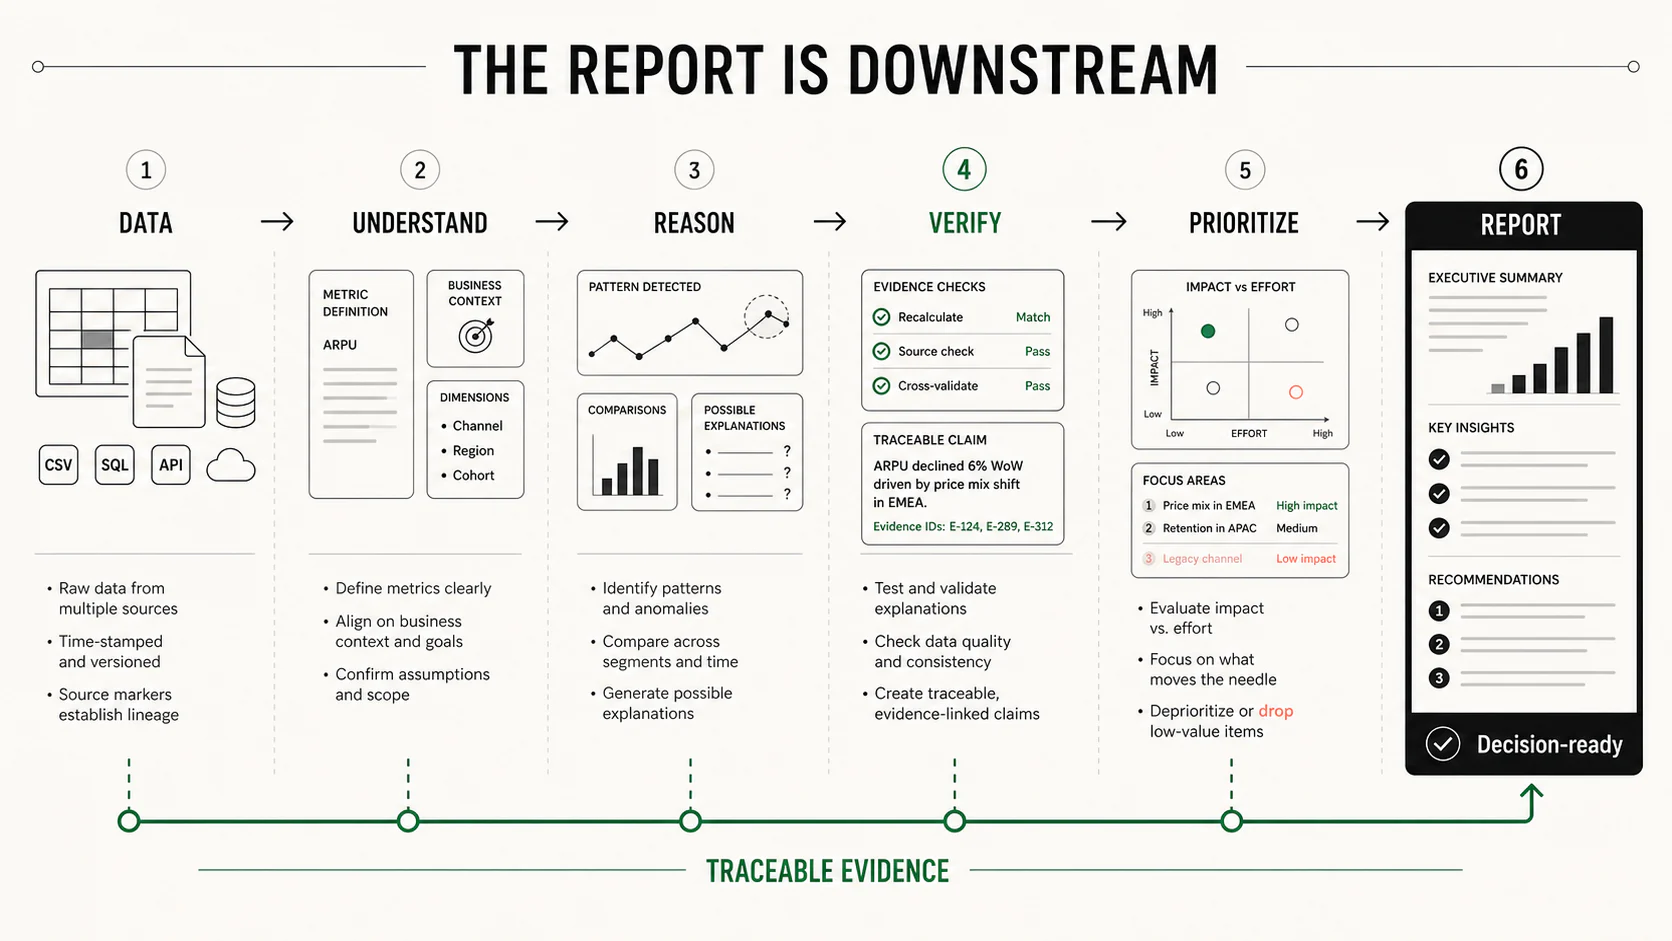
I don't think every AI reporting product needs to follow exactly this sequence. That's not really the point. The point is that the report itself is downstream of a lot of decisions. Before writing a confident sentence, a system has to make sense of what it's looking at. Before saying something is important, it needs some reason to believe it is.
Before explaining why something happened, it should know whether the available evidence is actually enough. And sometimes the right answer should probably be:
We don't know yet.
That is much less satisfying than a polished explanation. But it may be more useful.
From an AI Report Generator to a Data Reporting Agent
This is where our thinking around ExcelDashboard AI started to shift. For a long time, we asked questions like: How do we generate better charts? How do we make the slides more editable? How do we make the report easier to present?
We still care about all of that. A report has to be usable. But we're spending more time on a different question now:
What has to happen before the system earns the right to sound confident?
That question is much more interesting to me. It is also why we increasingly use the term Data Reporting Agent rather than just an AI report generator. By a Data Reporting Agent, we don't simply mean an AI that can produce more pages or perform more steps automatically. We mean a system that tries to understand what it is reporting before it reports it. A system where important conclusions should have evidence behind them.
A system that can separate what the data actually shows from what it is inferring.
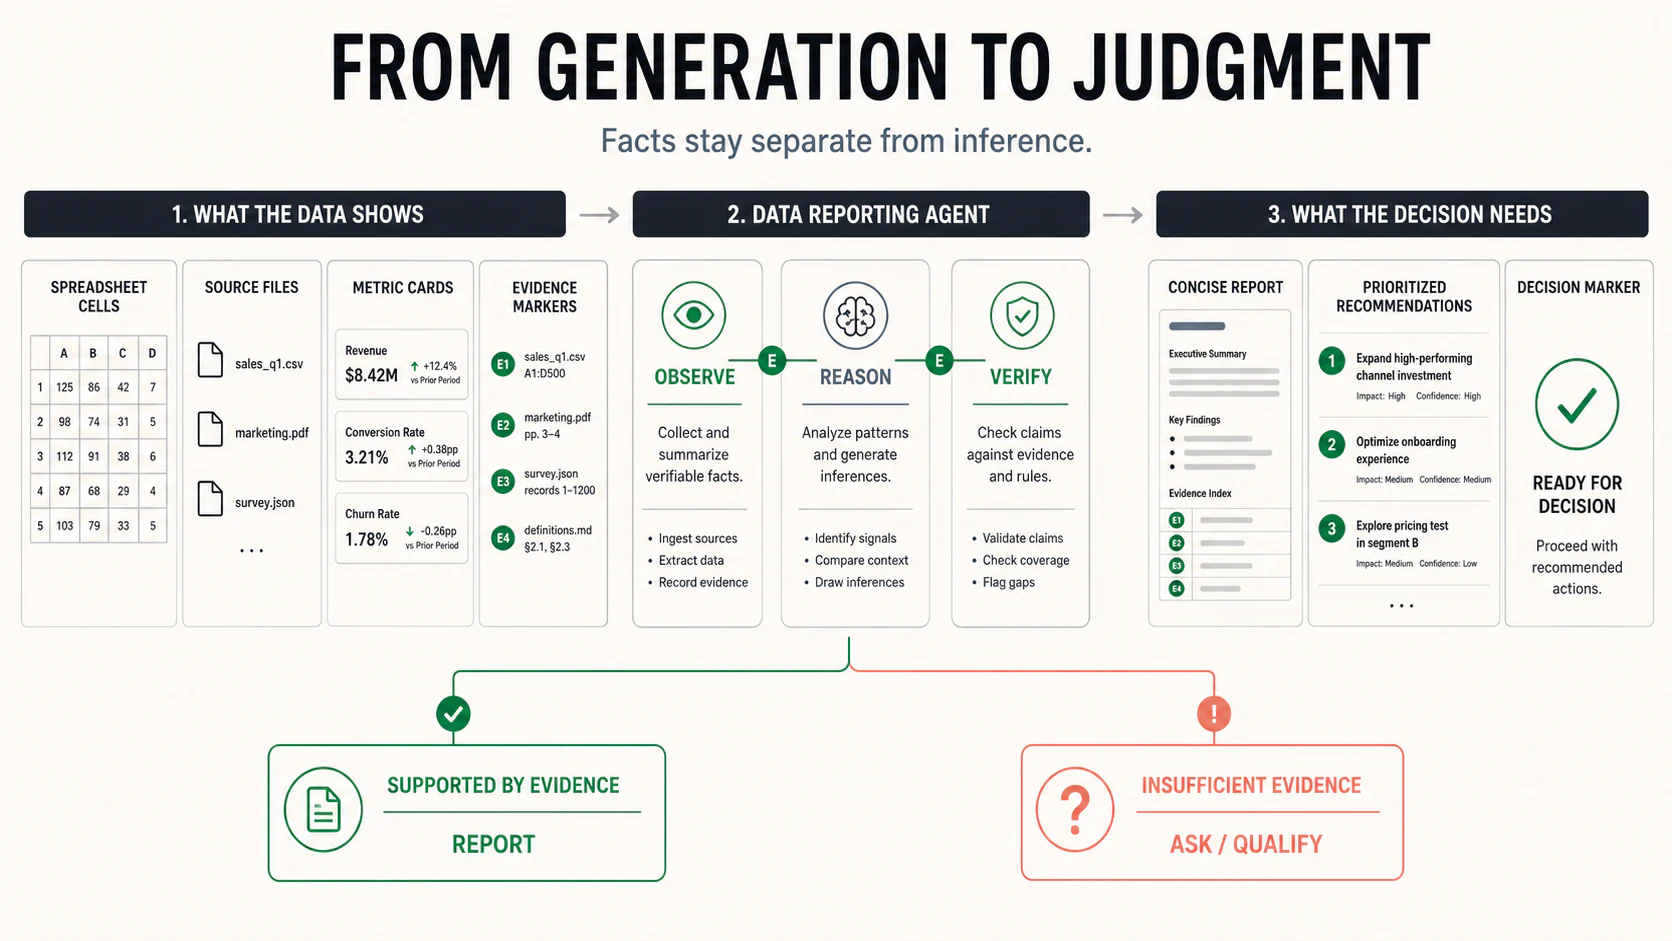
And one that doesn't treat every technically correct observation as equally important. We're not there yet. There are still cases where the output sounds more certain than the evidence deserves. Those cases are often more useful to study than the successful ones.
Better-Looking Reports Make This Problem More Important
There is a weird side effect of improving AI-generated reports. The better they look, the easier they are to trust. If a report is obviously rough, people inspect it. They question the wording. They check the chart.
They wonder whether the analysis is right. But when a report has a clean structure, professional charts, neat commentary, and a strong executive summary, that skepticism drops quickly. I've noticed this in myself too. And that's dangerous.
Presentation quality and reasoning quality are not the same thing.
A report can look finished before the thinking behind it is finished. That matters because business reports usually lead somewhere. Someone changes a budget. Stops a campaign. Pushes a product.
Questions a team. Changes next month's plan. The cost of a bad report is not the report itself. It's the decision that comes after it.
The Questions We Haven't Solved
The deeper we've gone into this, the less I think reliable AI reporting can be reduced to one feature or one model. There are still a lot of questions we don't have clean answers to. What should an AI do when a business metric is ambiguous? How much evidence is enough before it explains a change? When several findings are valid, how should it decide which one deserves attention?
What should happen when the data needed to answer a question simply isn't there? When should the system give an interpretation, and when should it just say that the evidence is insufficient? And there is a bigger question underneath all of this:
How do we know whether one AI-generated report is actually better than another?
Not prettier. Not longer. Better. We're working on these questions while building ExcelDashboard AI, and I expect our answers will keep changing. That's partly why I'm starting this research note series.
Not to publish the internals of how our product works. More to document the problems that keep showing up while we build it. The problems are turning out to be more interesting than the report generation itself. Because generating the report is now often the easy part.
Knowing when to trust it is harder.
Building the Data Reporting Agent is a research note series from ExcelDashboard AI about the problems we encounter while building AI systems that turn business data into trustworthy reports.